The Sun has been known for all time as the life giver on this planet, although ancient peoples did not understand why, and many worshiped the Sun as a God, or even the God of Gods, their view of the Sun was not wrong – without our local star, we would not be here, actually, as far as we understand the evolution of objects, without the Sun, none of the planets in our solar system or any of the myriad minor objects of the solar system would or could exist.
So, lets start with some fundamental questions.
What is The Sun?
Simply put, the Sun is a star, no different to any of the other stars that we can see in the night sky, in fact, one of the nearest stars to us, α Centauri A (pronouned Alpha Centauri A), is an almost identical twin of the Sun in many ways, but as far as we know, they did not form in the same part of the galaxy. α Centauri A is the primary star of a triple star system that are the closest stars to the solar system.
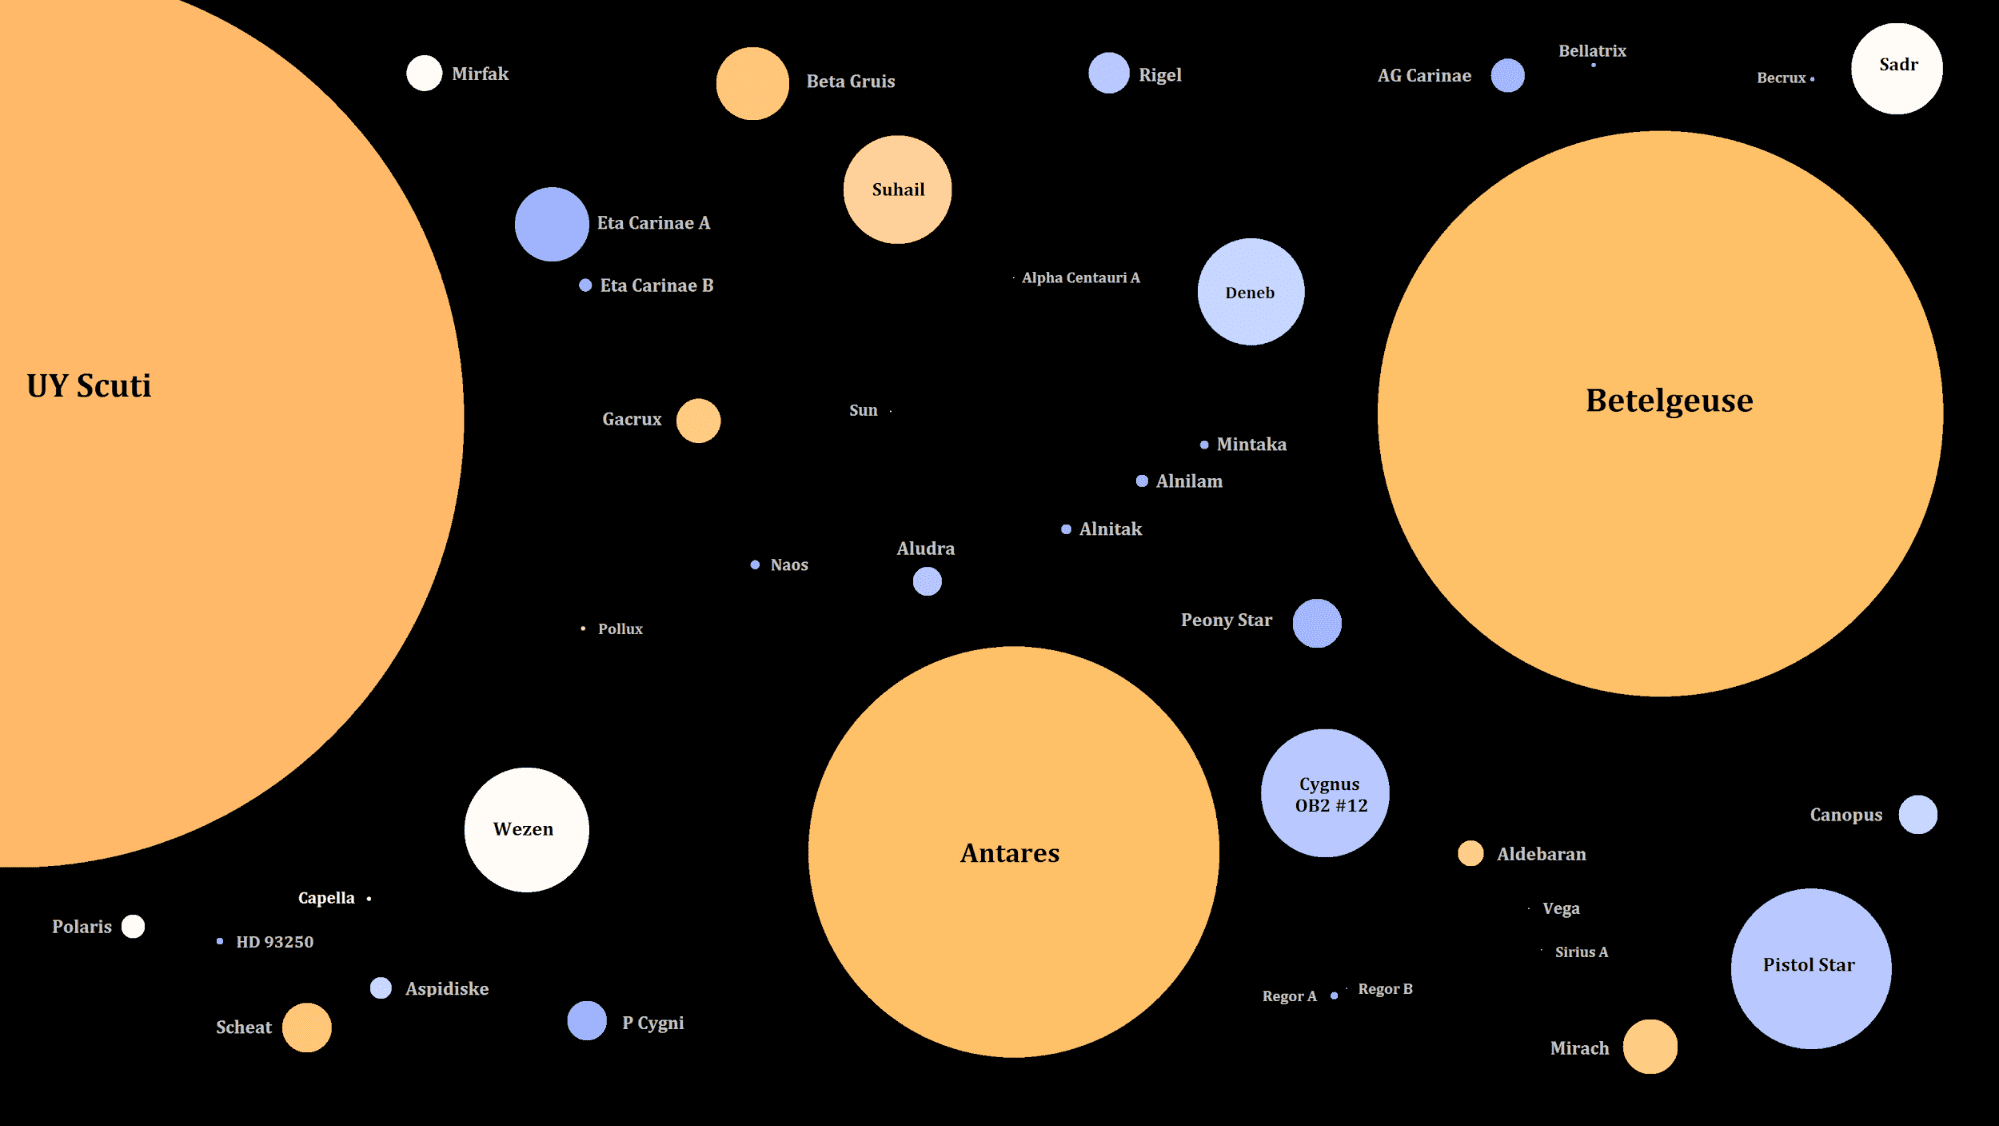
When comparing stars we can see they are all different colours and all different sizes, they are like people in that regard, but there that analogy ends. The Sun is not an everyday star in many ways, is is significantly brighter than the majority of stars, and it is significantly more massive than most – however, don’t be fooled, in the grande scheme of things star related, the Sun is still a dwarf star, both in respect of it’s mass and it’s actual size.
We know our galaxy has a mass of around 120,000 million Suns, but we now know, that the majority of stars are significantly smaller than the Sun, which makes the true number likely closer to about 450,000 million stars, this is because the vast majority of stars are of a type we call Red Dwarves, they range is mass from about 20 times the mass of Jupiter to about 70% the mass of the Sun, and they range in physical size from around the diamter fo Saturn to about 5 times the diameter of Jupiter – or about 50% the diameter of the Sun.
The nearest star to the solar system we have positively confirmed is a diminutive Red Dwarf called Proxima Centauri, it orbits the stars α Centauri A-B, which, together, form the nearest star family to to the Solar system. Proxima Centauri is only about 12% the mass of the Sun and about the diameter of around 14% (195,000km). This is a fairly typical red dwarf, or M-Type star.
A lot on online resources will tell you the above information – but there is a question here – ” I know the Sun is a star, but what is a star and how does the Sun fit in with other stars?”
What is a Star?
We once thought stars were holes pocked in a sphere that the Earth sat inside, later people thought the Sun was a giant burning block of coal – although maths soon showed that was seriously flawed once people realised that Earth was a lot older than people once believed. Without delving too deep into creation theories across hundred of cultures, what we know now is that the Sun, and all stars, are giant thermo-nuclear engines that convert lighter matter (Hydrogen) into heavier matter (Helium) and release a lot of energy in the process. It is not that simple, but lets not get bogged down in nuclear physics either.

So the Sun is a common, all garden Star, no different in the basic to any of other myriad stars in the observable Universe – there are exceptions, but we will not deal with that here, that is a section all on it’s own.
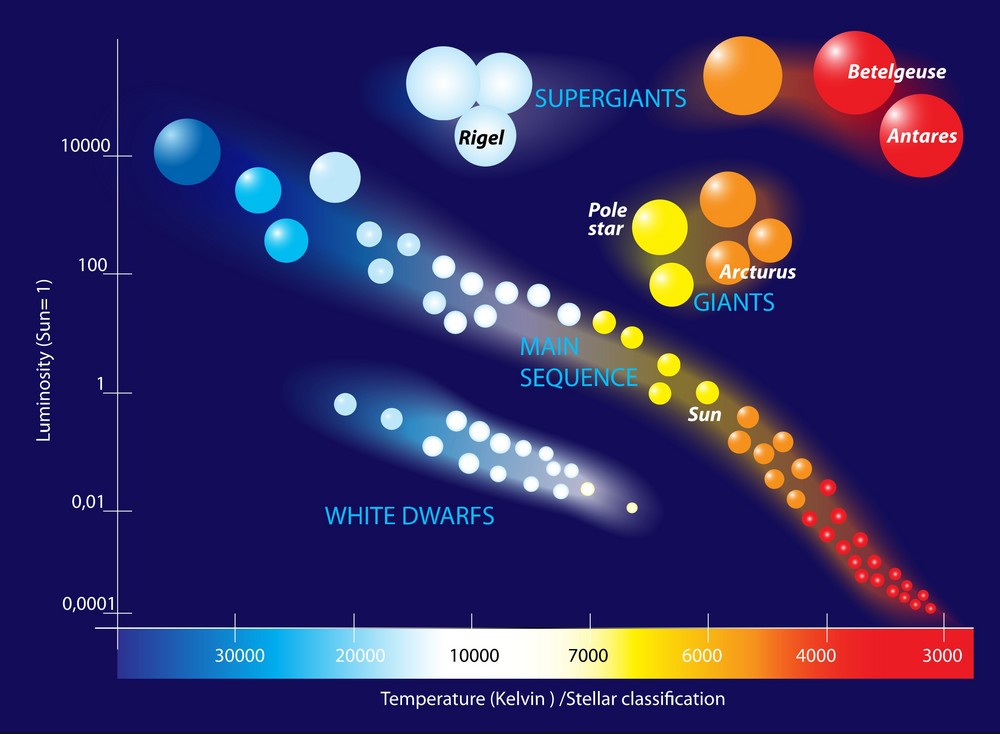
Anyway, we need to put the Sun into some form of context, many years ago two Astronomers developed a system, still used today. The Hertzsprung–Russell diagram, abbreviated as H–R diagram, HR diagram or HRD, which is a scatter plot of stars that shows the relationship between the star’s luminosities and their stellar classifications which is a product of their effective temperatures. The diagram was created independently in 1911 by Ejnar Hertzsprung and by Henry Norris Russell in 1913, the combination of these properties of stars, plotted on a single diagram represented a major advancement in the understanding of stellar evolution. It also allows readers of the diagram to show how the Sun stacks up against other stars. See Below.
There are differing types/groups or families of stars and which group a star belongs to is a factor of it’s mass and age – all other ways to classify a star are dependent on these two basic features.
- Neutron Stars / Magentars – The smallest, with a mass around that of the Sun in a sphere about the 15km across. – although these have very hot surface temperatures – in excess of 30,000°K, they do not appear on the H-R Diagram.
- White Dwarf stars – The remnant of smaller stars that have runn out of fuel and puffed off their outer layers, they have a mass from as little as 0.17 times that of the Sun right up to 1.3 times that of the Sun, with the mean mass for the population being 0.6 times that of the Sun. These are represented on the lower left of the H-R Diagram. Type VII
- Brown Dwarf – These are not planets, but they are not true stars – they lack sufficient mass to result on runaway Nuclear processes in the core so they are cool and lay at the far right of the bottom of any H-R diagram – most of those discovered so far have surface temperatures of about 1500-2000°K which is the result of low level nuclear reactions and gravitational compression. Type VII
- Sub-Dwarf – These are low mass stars but may be of various classes of star from the Brown Dwarves to those in spectral classes O & B, they are all below the main sequences at appear on the bottom of the diagram. Type VII
- Red Dwarf – These range from about 10% (0.1M☉) the Suns mass to about 80% (0.8M☉) the Suns mass – these are very long lived stars as they burn their fuel very slowly. They appear toward the bottom right of the H-R Diagram. Mostly Type V but may be Type VII
- Main Sequence – This is a mishmash naming of the group that all stars must pass through to evolve to another type. It runs from the top left to the bottom right on an H-R Diagram, but is an unhelpful classification in many ways as stars of all spectral types may be a main sequence star, depending on it’s age. However, there is no better system. Type V stars
- Sub-giants – These are stars that are markedly more massive than the Sun – 2-6 (2-6M☉) times the Sun’s mass – but are effectively a main sequence star, these will evolve from the main Sequence to the upper right, how far they evolve depends on their mass. Type IV
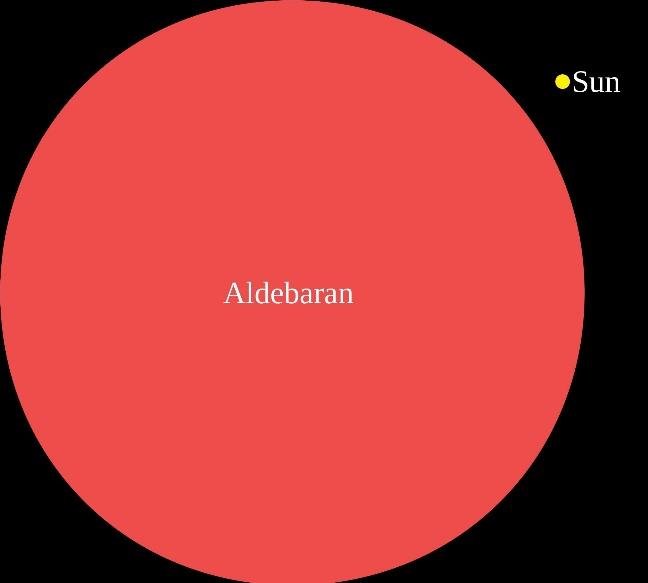
- Giant Stars – These are stars that have a mass between 6 (6M☉) and 10 (10M☉) times that of the Sun – These are Main Sequence stars for the most part – but some stars from lower classes will evolve to become giant stars in dimensions if not mass, Aldebran (α Tauri) – the brightest star in the zodiac constellation Taurus – has a mass similar to the Sun (1.16M☉) but has a diameter some 44(44R☉) times that of the Sun – in the solar system it would stretch almost as far as the orbit of Mercury. Aldebran is an evolved star, estimated to be about 6.5 billion years old, it has evolved off the Main Sequence so it now resembles what the Sun will evolve into is about 2 billion years. – I don’t think humans will be here to observe the evolution. The majority of these stars will evolve to the point where they undergo core collapse and explode as a supernova. Type II or Type III stars depending on luminosity where brighter stars are type III
- Supergiant Stars – Like giant stars, these fall into two categories, Main Sequences stars with a young age and a mass over 10M☉, these can be found from the upper left to the upper central part of the H-R Diagram, an example of such stars is Rigel (21M☉ )(α Orion), however, the vast majority of Supergiant stars are highly evolved, high mass stars in excess of 12M☉ and show characterists that mean that are no longer on the main sequence. These stars, depending on their mass, may move back and forth at the top of the H-R diagram from white supergiants, to Luminous Blue Variables, to Red Supergiants, there are even yellow Supergiant – all of these stars will end their lives as a supernova. Depending on their luminosity and characteristsics these will be Type Ia, Type Iab or Type B
- Hypergiant Stars – these are extremely rare stars, only about 30 are known to exist in the Milky way – these are sometimes called galactic hypergiants – but they are the same type of star. Most have a mass in excess of 30 times that of the Sun, and diamters so big the Orbit of Earth would be inside the star. Examples of these stars are Eta Carina, P Cygni, S Doradus and Zeta Scorpii – these do no appear on the classic H-R diagram as they were unknown at the time of it’s creation – for reference, they would appear above the stellar families in the diagram below and may spread from the left to the right. These will all end their life as a supernova, possibly even a hypernova. They are also linked to the theoretical “failed supernova” where really massive stars begin the supernova process, but the core becomes a stellar mass blackhole before it finishes, consuming the star from within and just “blinking out” of existance. These will be Type 0 or Type 1a
Yerkes Luminosity Types
| Luminosity class | Description |
| 0 or Ia+ | Hypergiants or extremely luminous supergiants |
| Ia | Luminous supergiants |
| Iab | Intermediate-size luminous supergiants |
| Ib | Less luminous supergiants |
| II | Bright giants |
| III | Normal giants |
| IV | Subgiants |
| V | Main-sequence stars (dwarves) |
| sd (prefix) or VI | Sub-dwarves |
| D (prefix) or VII | White dwarves |
Harvard Spectral Classificastion System
| Class | Effective temperature | Chromaticity | Main-sequence mass (M☉) | Main-sequence radius (R☉) | Main-sequence luminosity (Bolometric) | Hydrogen Line strength | Fraction of all Stars |
|---|---|---|---|---|---|---|---|
| O | ≥ 30,000 °K | blue | ≥ 16 M☉ | ≥ 6.6 R☉ | ≥ 30,000 L☉ | Weak | ~0.00003% |
| B | 10,000–30,000 °K | deep blue white | 2.1–16 M☉ | 1.8–6.6 R☉ | 25–30,000 L☉ | Medium | 0.13% |
| A | 7,500–10,000 °K | blue white | 1.4–2.1 M☉ | 1.4–1.8 R☉ | 5–25 L☉ | Strong | 0.60% |
| F | 6,000–7,500 °K | white | 1.04–1.4 M☉ | 1.15–1.4 R☉ | 1.5–5 L☉ | Medium | 3% |
| G | 5,200–6,000 °K | yellowish white | 0.8–1.04 M☉ | 0.96–1.15 R☉ | 0.6–1.5 L☉ | Weak | 7.60% |
| K | 3,700–5,200 °K | pale yellow orange | 0.45–0.8 M☉ | 0.7–0.96 R☉ | 0.08–0.6 L☉ | Very weak | 12.10% |
| M | 2,400–3,700 °K | Red | 0.08–0.45 M☉ | ≤ 0.7 R☉ | ≤ 0.08 L☉ | Very weak | 76.45% |
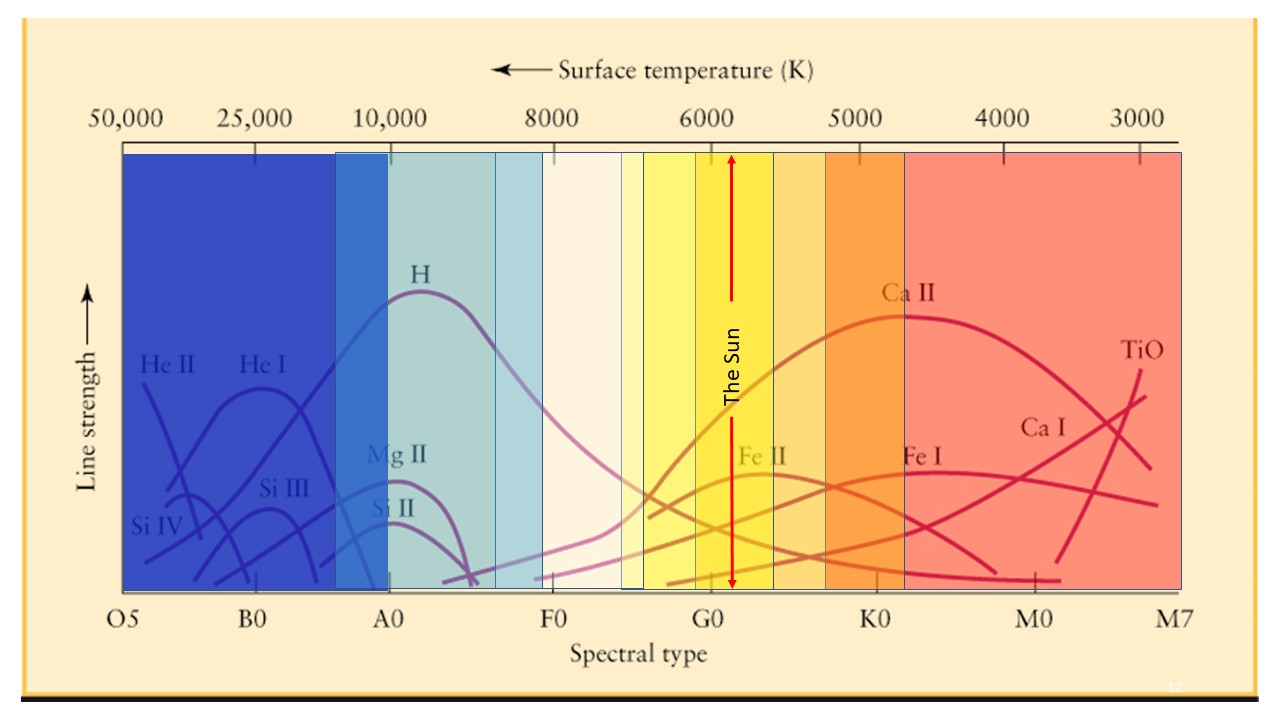
As you can see on the H-R diagram above the Sun sits in the Main Sequence portion of the diagram, the Yerkes classification tells us that it is a Type V star, and the Harvard Luminosity class tells us the Sun, with a photosperic temperature of 5700°K will be a Yellow star – despite what some people on the internet claim – Each of the Harvard classifications is plit into sub-classes from 0 – 9, higher numbers mean the star is nearer to the next cooler class of star, in the case of the Sun, it is a G2 colour classification, so overall the Sun has a classification of G2V, but is a dwarf, so you may seen it written as dG2V or even G2Vd.
Here we can see how the Sun compares to other stars.
Physical Characteristics of the Sun
Nearly everything we read about objects in the solar system are using scales purely compared to Earth, Earth’s orbit or the Sun – but unless you know these details these are meaningless, so lets look at this from an outsiders perspective. Start with the basics.
Solar Physical Charactistics
| Mean distance from Milky Way core | Approx' 26,660 light-years |
| Galactic period | 225 Million years |
| Velocity | ~ 251 km/s (orbit around the center of the Milky Way) |
| ~ 20 km/s (relative to average velocity of other stars in stellar neighborhood) | |
| ~370 km/s (relative to the cosmic microwave background) | |
| Physical characteristics | |
| Equatorial radius | 695,700 km |
| 696,342 km | |
| 109 × Earth radii | |
| Equatorial circumference | 4.379×10⁶ km |
| 109 × Earth | |
| Surface area | 6.09×10¹² km2 |
| 12,000 × Earth | |
| Volume | 1.41×10¹⁸ km3 |
| 1,300,000 × Earth | |
| Mass | 1.9885×1030 kg |
| 332,950 Earths | |
| Average density | 1.408 g/cm |
| 0.255 × Earth | |
| Center density (modeled) | 162.2 g/cm3 |
| 12.4 × Earth | |
| Equatorial surface gravity | 274 m/s2 |
| 28 × Earth | |
| Escape velocity | 617.7 km/s |
| Temperature | Center (modeled): 1.57×10⁷ °K |
| Photosphere (effective): 5,772 °K | |
| Corona: 5, 000,000°K+ | |
| Luminosity (Lsol) | 3.828×1026W |
| 3.75×1028 lm | |
| Color (B-V) | 0.63 |
| Mean radiance (Isol) | 2.009×10⁷ W·m-2·sr-1 |
| Age | 4.6 billion years (Estimate) |
| Photospheric composition (by mass) | 73.46% Hydrogen |
| 24.85% Helium | |
| 0.77% Oxygen | |
| 0.29% Carbon | |
| 0.16% Iron | |
| 0.12% Neon | |
| 0.09% Nitrogen | |
| 0.07% Silicon | |
| 0.05% Magnesium | |
| 0.04% Sulphur | |
| Sidereal rotation period | 25.05 days at equator |
| 34.4 days at poles | |
| Rotation velocity at the equator | 1.997 km/s |
The Sun is significantly larger than Earth, and significantly larger than all the planets in the solar system, here is some basics.
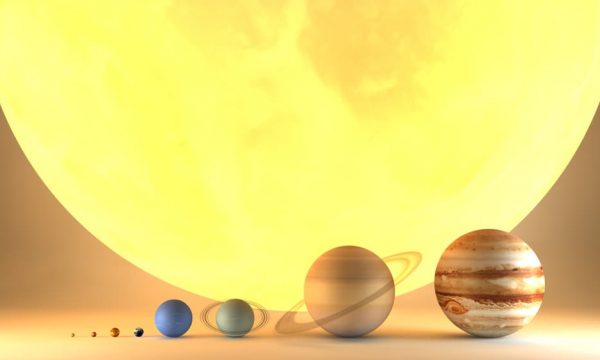
To fully understand the scale of the sun, let’s compare its size to the planets that call it home – remembering, the Sun contains 99.986% of the mass of the entire Solar system and thus is is more than 500 times the mass of all the materials in the solar system combined.
Comparing the Sun to the Planets
Planet How Many needed to cross the Face of the Sun How many planets required to match the Mass of the Sun Mercury 277 21 million Venus 115 1.5 million Earth 109 1.3 million Mars 207 7 million Jupiter 11 1,000 Saturn 12 1,600 Uranus 27.7 21,000 Neptune 27.4 22,000 Pluto 585 22 million
Before we move on, I want to address a couple of things that come up from time to time on Internet discussions, namely that Jupiter was once a star or that Jupiter will become a star in the future.
Neither of these ideas are true, the fact is, the interiors of protostars and Gas Giant planets are markedly different, lets look.
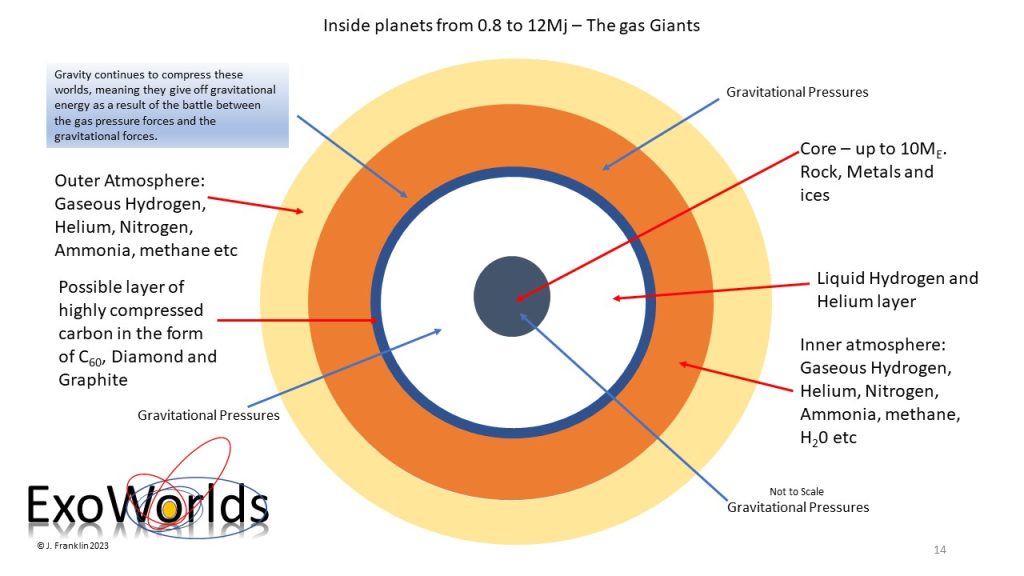
The fact is, for Jupiter to be even the smallest brown dwarf it would need to increase its mass by at least 13 times, and to become a red dwarf, even the smallest know, it would require at least 85 times it’s existing mass – there is insufficient mass in the solar system for this to happen, even if a disaster befell the solar ystsem and all the planets, asteroids, comets, moons etc fell into Jupiter, they would not even increase it’s mass by more than 35%, still more than 11 times short of becoming a brown dwarf.
The Sun will expand into a red giant in about 2 billion years, the exact time frame we still do not know, but that is the minimum, regardless of when it does it, it will significantly increase it’s volume as it’s outer layers expand outward, an analogue for the Sun is alpha Tauri – Aldebrarn, which has a mass 1.16 times that of the Sun, is around 2 billion years older, and is a red giant some 45 times the diamter of the Sun – if we replaced the Sun with Aldebaran, it would stretch almost all the way to Mercury.
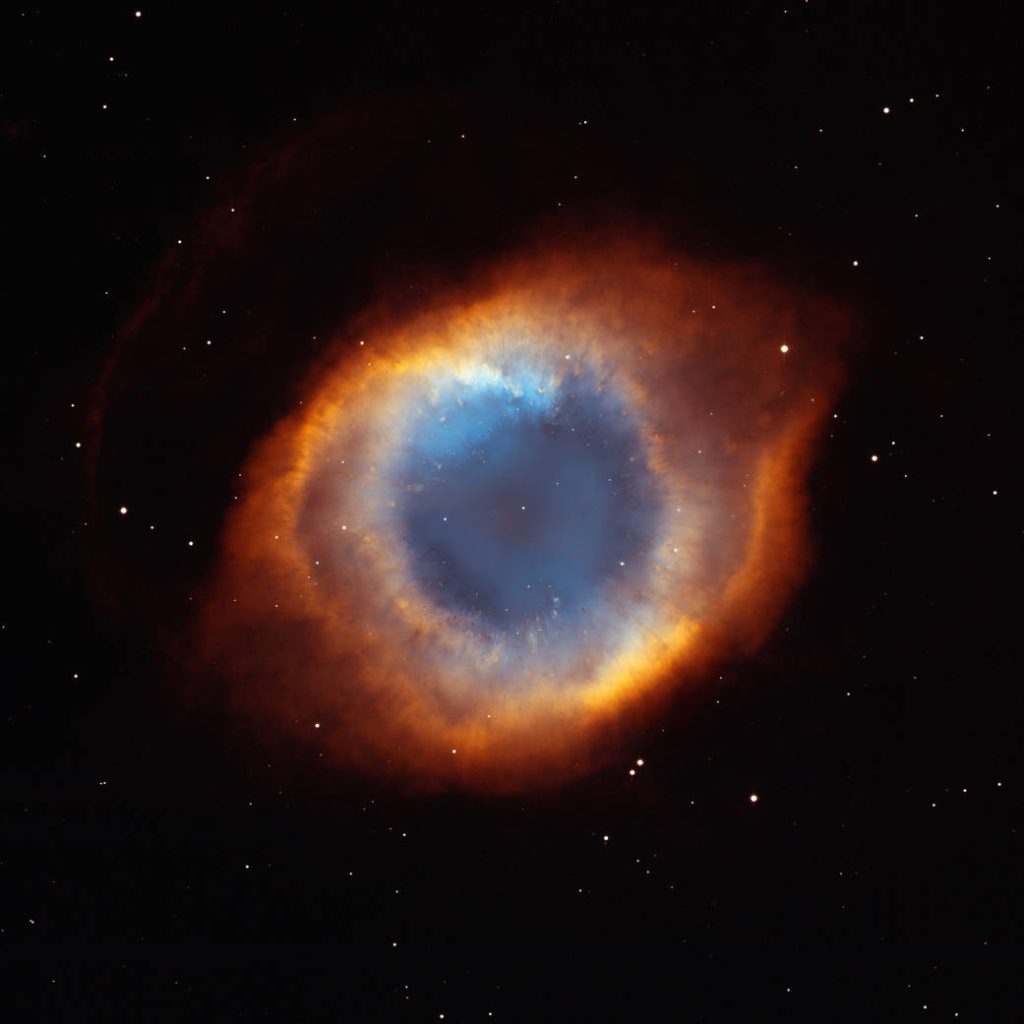
As the Sun expands to become a red giant the outer layers will be lost to space, many red giants eventually form planetary nebula, nearby one to Earth is the Helix Nebula.
Now as the Sun sheds these outer layers into space, it is safe to conclude that all the planets with magnetic fields will capture the charged particles being shed by the Sun and absorb them into their make-up, Jupiter, having the most powerful magnetic field after the Sun, and the biggest gravity well, will likely accrete the largest share of the material the planet absorb, but in relaity, this will likely be a very tiny fraction of the estimated 25% to 50% of the Sun’s mass that is ejected back into space – and it is unlikely, though not impossible, for Jupiter to increase it’s mass 13 times, let alone 85 times.
One last point to note – we are still not sure of the exact process that creates a planetary nebula, there are certainly a lot less than there ever have been red giants that have dies, and whilst planetary nebula are short lived, surviving perhaps a few million years before being disrupted or dissipating, there does seem to be less than one would otherwise expect, but we must be careful drawing any conclusions because there is simply too much we still do not know.
The Sun – Lets get complex.
The above sections dealt with the simpler side of what the Sun is and how it works, where it sits and comparisons to allow the reader to “see” the Sun as a body by itself on a scale they can visualise. Now is the time to delve deeper into matters, so those interested, can truly understand the Sun, or at least as far as current reasearch takes us.
What is the Sun?
We answered that above, the Sun is a star, and we saw how it compares to other stars in a basic way, but now lets really drill down into what a star, like the Sun, truly is and how it works inside.
Lets go back to the beginning – what, where and when did the Sun come from and into being.
As far as we know, from current models, the Sun is between 4.6 and 5.4 Billion Years old, we know this because the oldest rocks on Earth are around 4.28 Billion years old, and we know they formed after the planet, likely about 500 million years after, which means the Earth formed around 4.6-4.8 billion years ago – thus, the Sun must be a similar age based on the models and theories we currently have, the Sun could be a little older, but likely not as a full blown star, it likely spent millions of years forming and existing as a protostar.
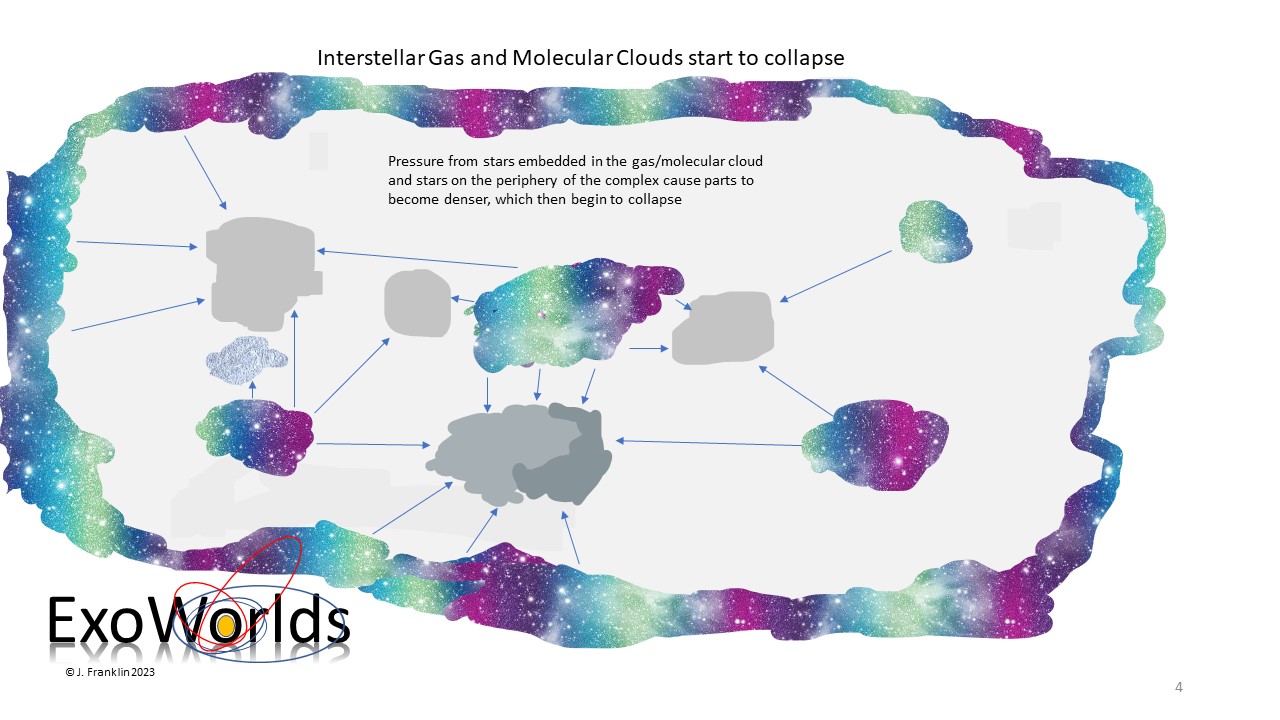
We do not yet fully understand how stars begin to form, but the current theory, supported by models, we believe that clouds of gas and dust are compressed by a combination of factors,radiation pressure from stars embedded in the clouds surrounding it and passing therough it, as well as the gravitational forces imposed by passing or nearby stars, we also know that nearby a supernova have a dramatic effect on these clouds and as a result, within parts of the cloud, gas and dust starts to condense, likely via a combination of motion and electrostatic forces, portions of the gas and dust is will have been ionised by interstellar radiation which would make the electrostatic forces more influential.
Figure A:
As the condensing parts of the cloud continue to collapse, those that are not disrupted by stars passing through them, or by a supernova too close, beging to form denser cores with material continue to fall into the centre whilst radiation and gravitational pressure continue to force matter toward the globule.
Figure B:
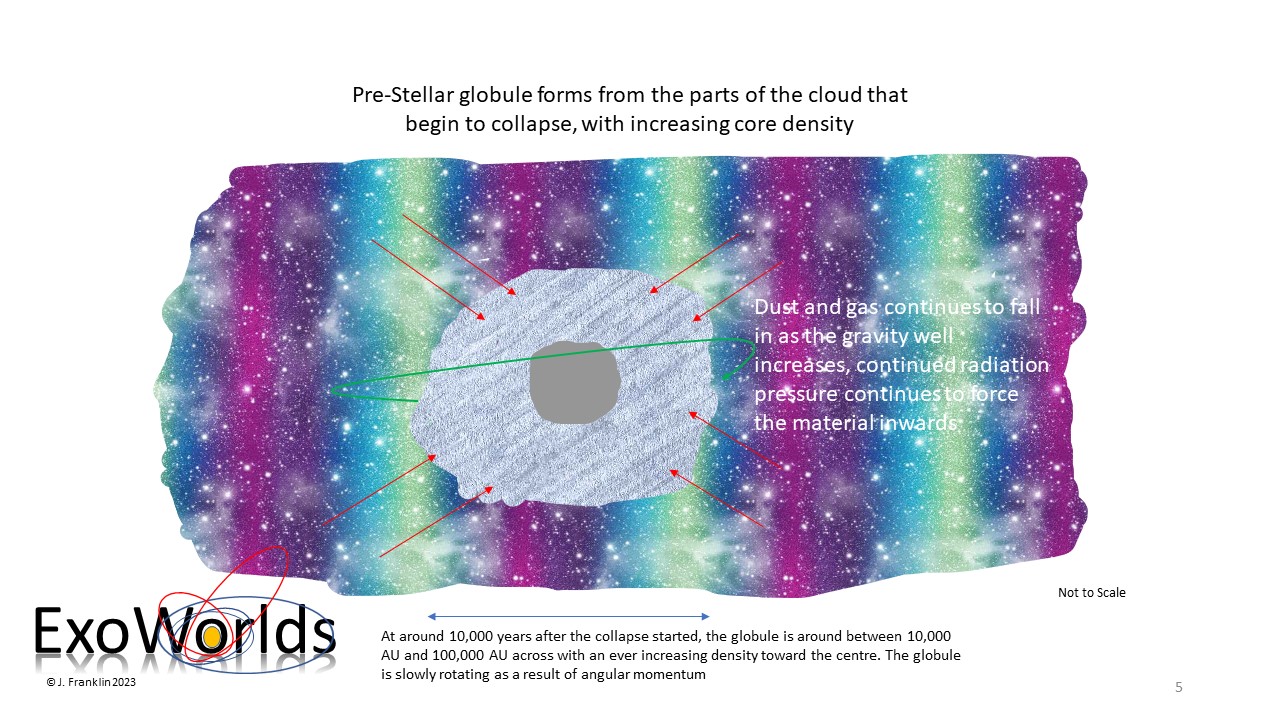
Over the next 10,000 to 100,000 years the cloud continues to coalesce into a recognisable shape, the dense heart begines to form a spherical shape that is surrounded by an accretion disk of material, the whole mass has maintained the angular momentum from the parent cloud, but as with a scater, the reduce dimensions result in an increase if rotational speed. The increased density of the centre increases it’s gravitational well, drawing in more and more matter.
Figure C:
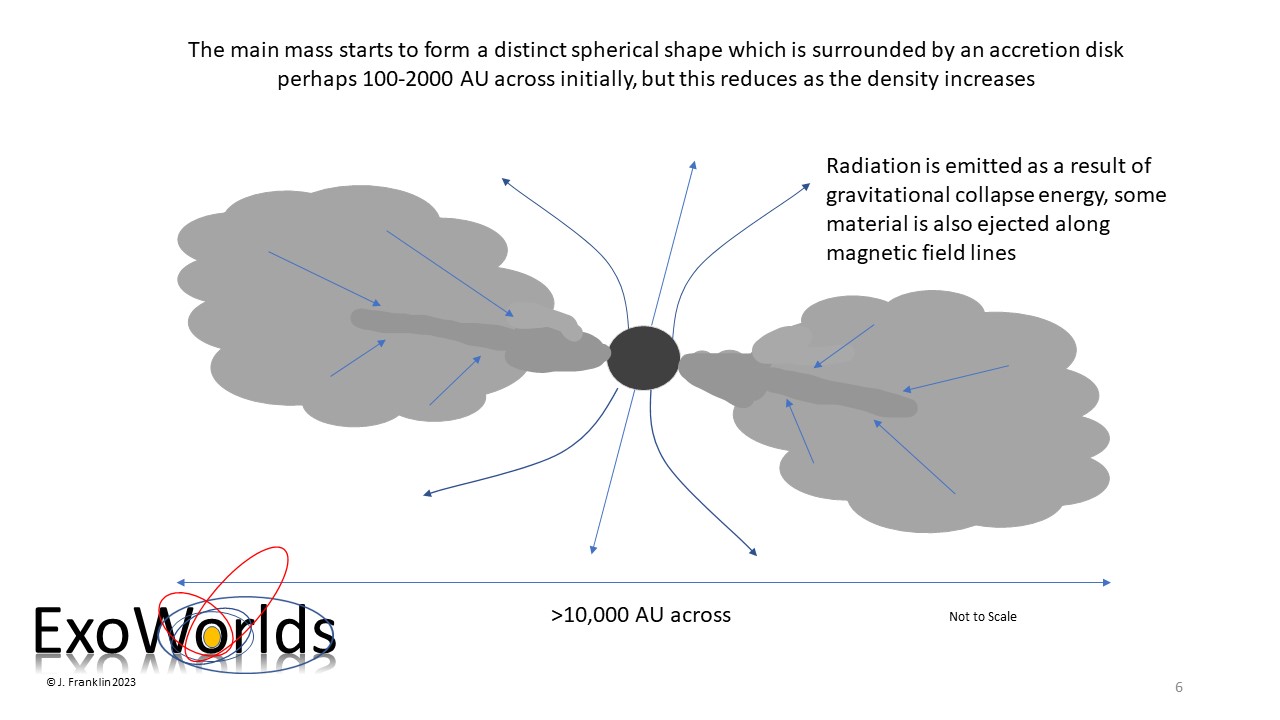
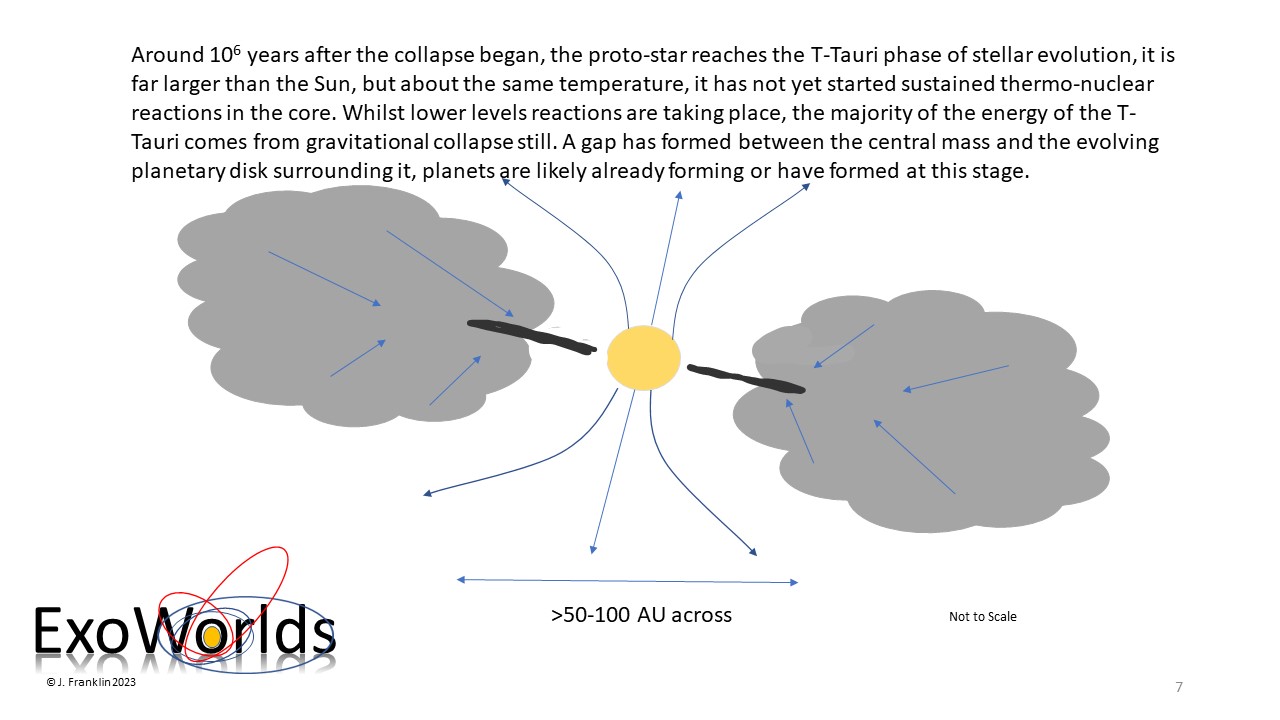
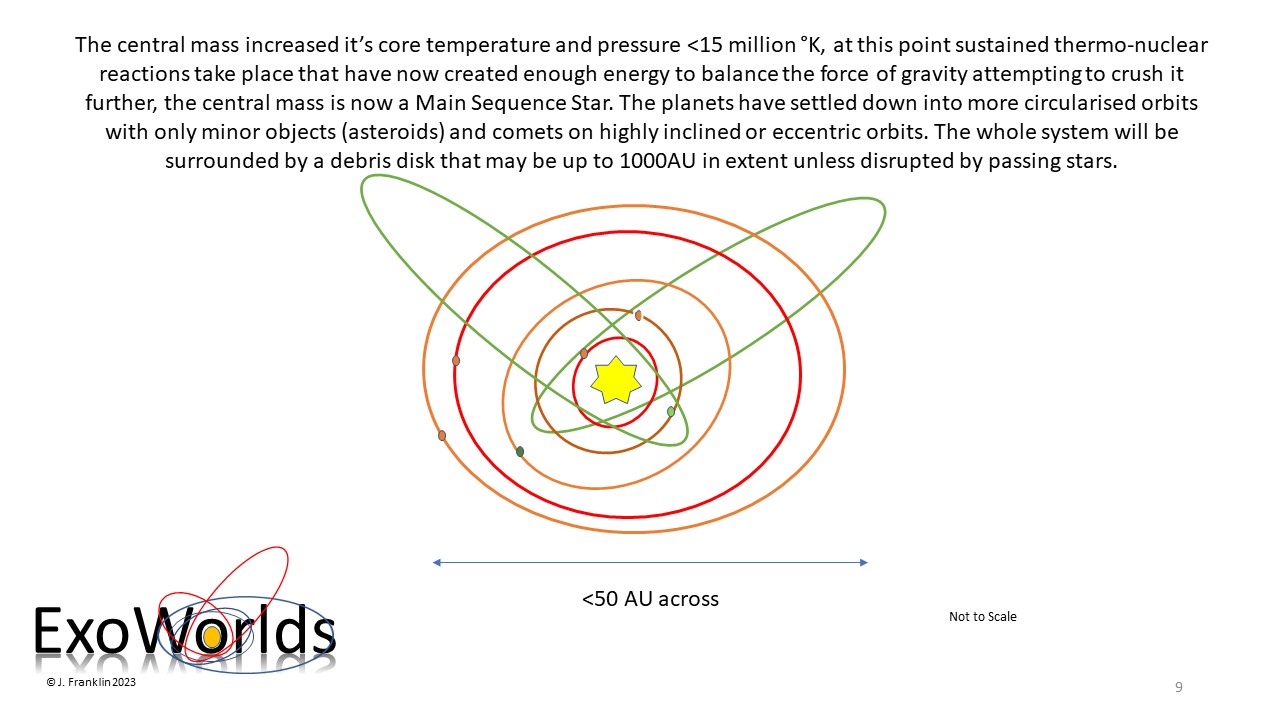
After an estimated 1 million years (106 years) since the cloud began to collapse, the central mass has increased to around 20% that of the Sun, it is not yet a star, but the proto-star has reached a critical milestone – it is now a T-Tauri object, these are bright, because they are large, with extended envelopes, the central mass is not yet sufficient to ignite thermo-nuclear reactions, gravitational pressure is still the main source of energy, but lower level reactions will start intermittaently at first, making T-Tauri objects unstable and prone to extreme variability with mass ejections on a colossal scale. The planetary disk forming around the central mass is now disconnected from it, at this stage it is probable that planets have formed already and may be starting to sweep gaps in the accretion disk.
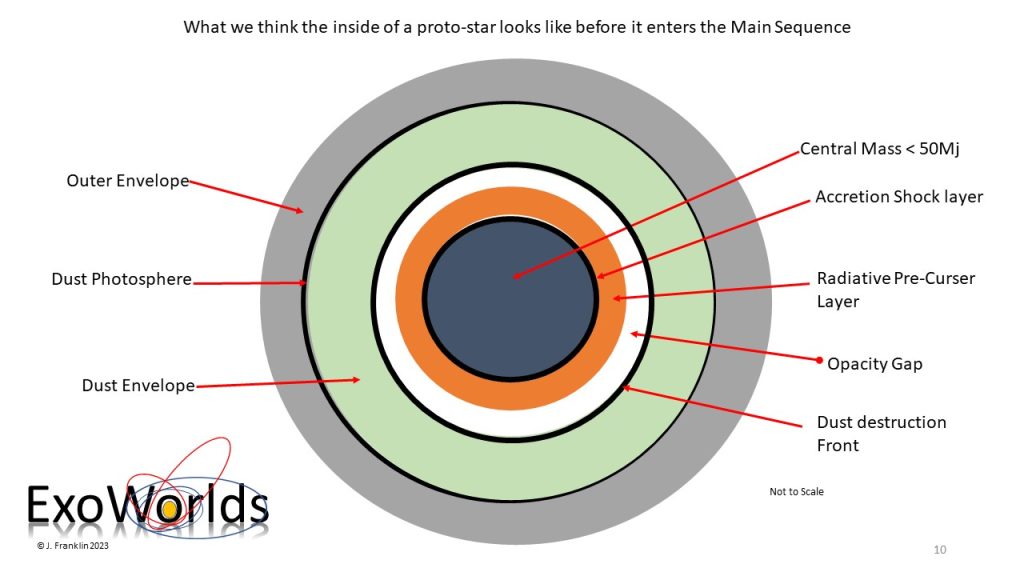
We do not know a lot about proto-stars, we have modelled them with the best knowledge we have, and we believe we have a resonable idea of what they look like inside.
Latest research indicates that this is our best image of what a proto-star looks like inside.
As the proto-star evolves the core heats up, mostly due to gravitational collapse, at this point the proto-star enters a phase called the T-Tauri phase, named for the first object of this type first identified. T-Tauri stars are highly energetic, extremely variable and with unpredicable massive flares, some flares likely rival nova in scale if not radiation output. The animated image of the bubble of material ejected from XZ Tauri is on a scale that exceeds the size of the solar system. XZ Tauri is a binary pair of T-Tauri stars.

Roughly half of all T Tauri stars identified appear to have circumstellar disks, which at this stage of stellar evolution are called protoplanetary discs, these are the progenitors of planetary systems. Circumstellar discs are estimated to dissipate on timescales of <10 million years.
Most T Tauri stars identified are in binary star systems. It is theorised that the active magnetic fields and strong solar wind of T Tauri stars are one means by which angular momentum gets transferred from the star to the protoplanetary disc.
Analogs of T Tauri stars in the higher mass range, from 2–8 solar masses, the A and B spectral type pre-main-sequence stars, are called Herbig Ae/Be-type stars. More massive, those over 8 solar masses, proto- stars in the pre–main sequence stage have never been observed, these massive stars evolve very quickly, by the time they have become visible by dissipating all the gas and the dust they were embedded in, the hydrogen in the center is already being transformed into helium by the Carbon-Nitrogen-Oxygen reaction, they already are main sequence objects before we see them clearly.
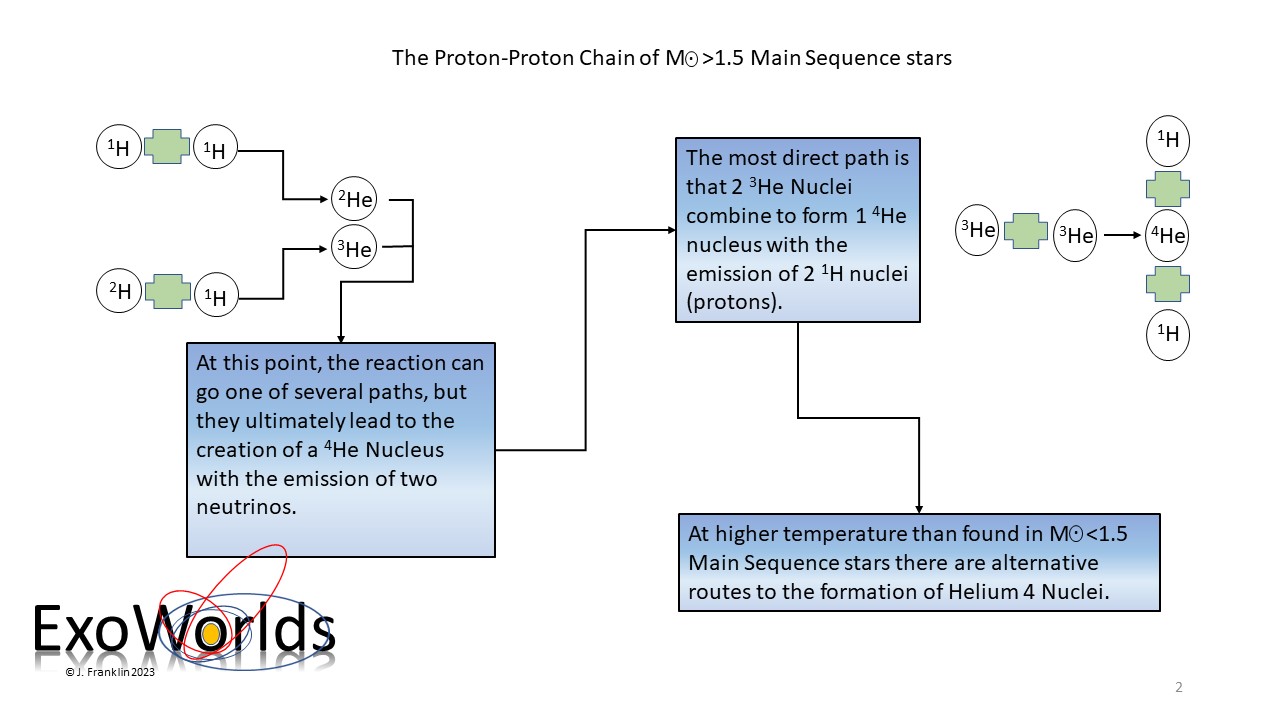
The type of reactions that power the larger stars are outside the capabilities of the stellar mass stars up to 1.5 times the mass of the Sun, they have to be content with the reactions that power our Sun, although it is capable of different types of reaction to power it.
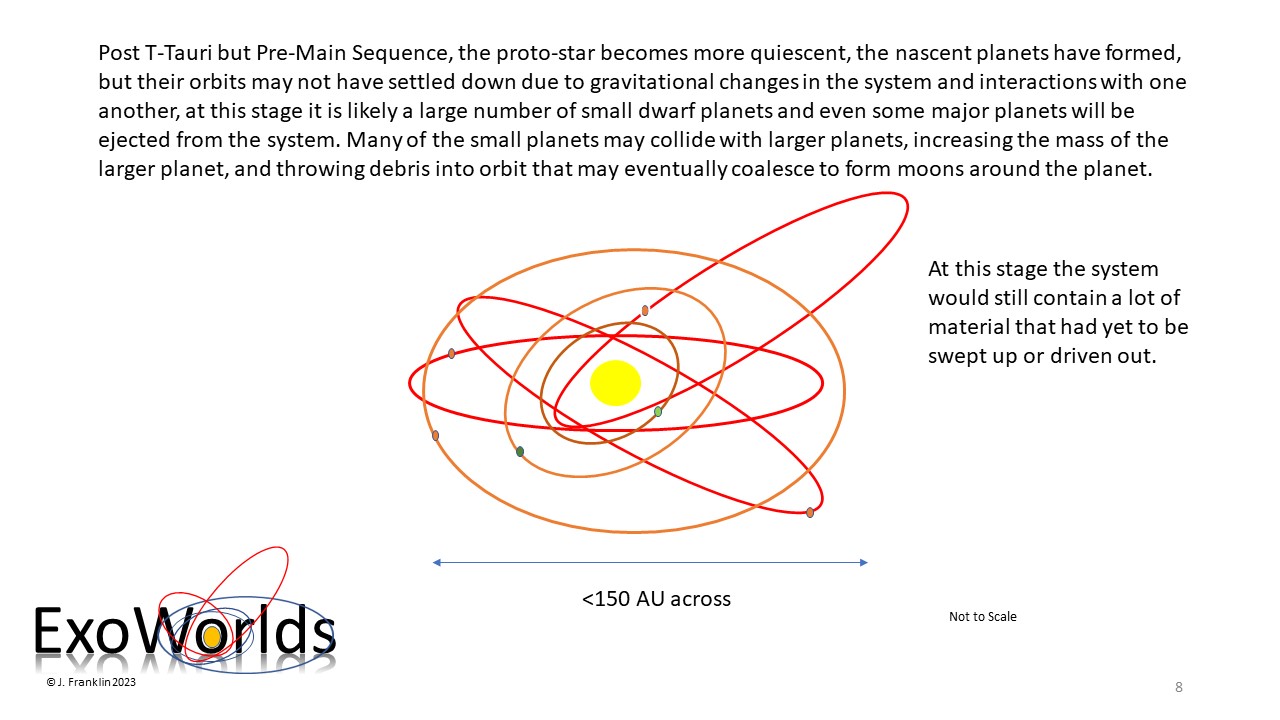
After the star has been in the T-Tauri phase for a several million years, perhaps as long as 10 million years, it’s mass has increased and as the core heats up, so the pressure builds, at this point the pre-stellar object enters the phase that sits between the T-Tauri phase and the Main sequence phase. Much of the material in the protoplanetary disk has either been swept up by the central mass or the planets that have formed within it, the remaining materials has been blasted out of the system by the extremely active T-Tauri phase or the energetic flow of material off the central object has pushed it out. Ionising radiation would allow for a lot of the materials to be swept up by any planet with a global magnetic field.
Where does the Sun gets it’s power from?
As we saw above, the basic process in the lower mass stars, those with a mass less than 1.5 times that of the Sun, is the proton-proton chain reaction
However, a small proportion of the Sun’s energy comes from another reaction cycle we now know takes place in the very heart of our star.
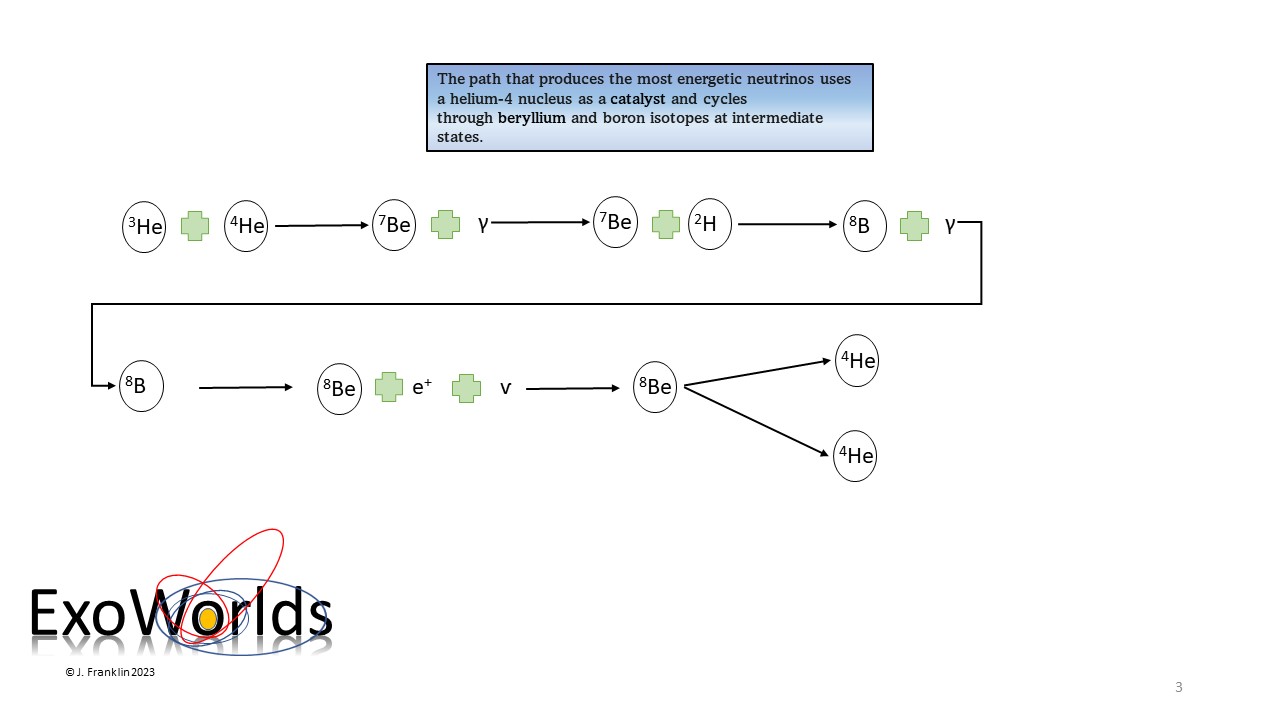
This latter reaction route occurs only at relatively high temperatures and is of interest because energetic neutrinos that are created in this reaction cycle were detected in a large-scale experiment using tetrachloroethylene (Cl2C=CCl2) (Used in Dry Cleaning clothes) as a detection medium, whilst other experiments detected neutrinos from the lower-temperature reactions of the proton-proton reaction. The detection rates in these experiments were statistically significantly smaller than theory had predicted. This decrease, referred to as the solar neutrino problem, caused a lot of debate for a long time, however it was discovered that the electron-neutrinos emitted by the Sun change to either muon-neutrinos or tau-neutrinos as they leave the Sun, the detectors built on Earth were optimized to detect electron-neutrinos and thus, we saw a shortfall over what the theories had predicted. This change in neutrino type is a consequence of neutrinos’ having a small mass and not being massless as originally supposed. Once this was realised, we had a far greater understanding of the inner workings of our star.
What is the Sun like Inside?
Well, we cannot image inside the Sun, and we certianly cannot visit either, but we can surmise what takes place beneath the broiling plasma that forms the visible surface of our star.
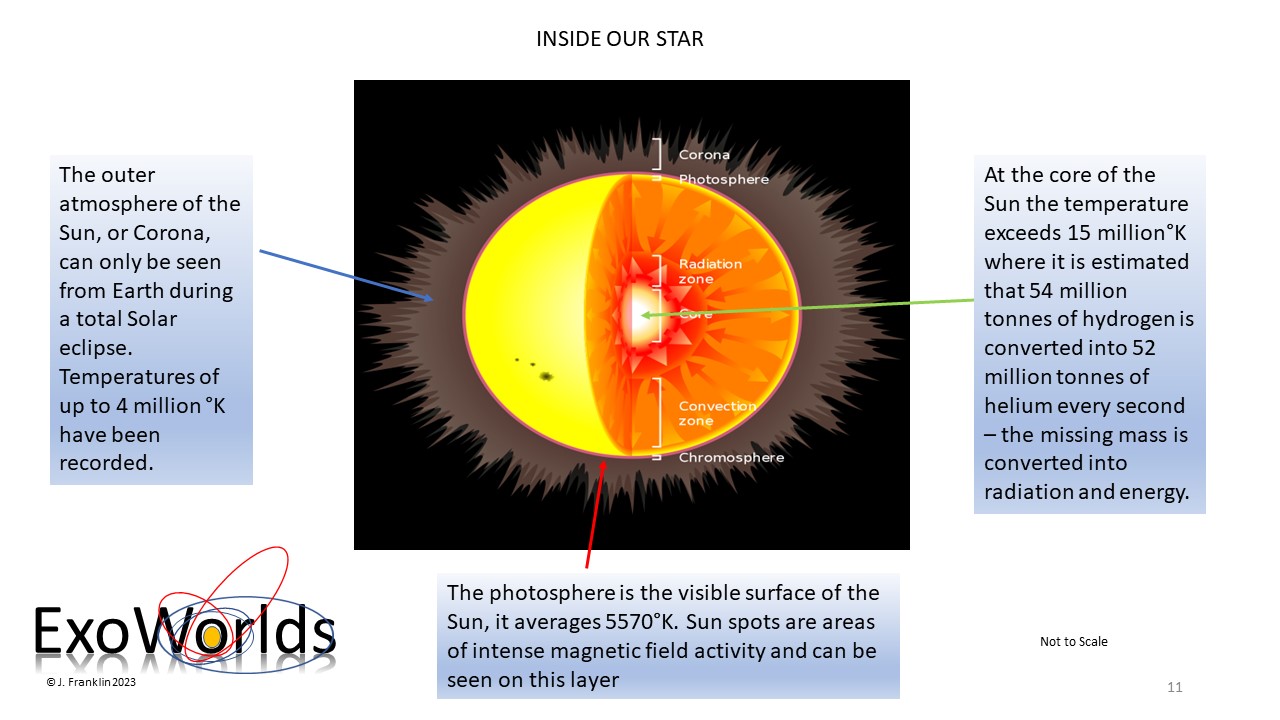
In late thirties, Grotrian (1939) and Edlen discovered that strange spectral lines observed in the spectrum of the solar corona are emitted by elements such as Iron (Fe), Calcium (Ca), and Nickel (Ni) in very high stages of ionization. They were the first to realise that the solar corona is hotter than the visible surface with temperatures in excess of 1 million °K
The question of why the solar corona is so hot remains one of most exciting astronomy puzzles for the last 80 years. There is no conclusive answer to that question yet, but there are plenty of theories and certainly plenty of clues.
Whilst the solar corona is extremely hot, it also has very low density, thus, only a small percentage of the total solar energy output is required to heat the corona. The total power emitted in X-rays is only about one-millionth of the Sun’s total luminosity, leaving more than enough energy in the Sun to heat the corona. One important question, the answer to which has eluded researchers for decades, is how this energy is transferred up to the corona, what mechanism is responsible for the transport?
Over the years, several different mechanisms of powering the corona have been proposed:
- Acoustic waves
- Fast and slow magneto-acoustic body waves
- Alfven body waves
- Slow and fast magneto-acoustic surface waves
- Current (or magnetic field) dissipation
- Microflares/transients
- Mass/particle flows and magnetic flux emergence.
These theories have been rigourously tested, both theoretically and observationally, currently, only acoustic waves have been ruled out, the preponderance of thinking currently sits around Microflares and magnetic field dissipation, but the jury is still out.
More recently, the “magnetic carpet” was related to the coronal heating puzzle.
Observations with high spatial resolution camera, and thanks to the continual observations of the SOHO space craft, show that the surface of the Sun is covered in weak magnetic fields concentrated in small patches of opposite polarity forming what has been dubbed the “magnetic carpet”. These magnetic concentrations are believed to be a the bases, or foot points, of individual magnetic flux tubes carrying electric currents.
Recent observations of this “magnetic carpet” show a very dynamical evolution: photospheric magnetic fields constantly move around, interact with each other, dissipate and emerge on very short period of scales, the magnetic reconnection between magnetic fields of opposite polarity appear to change the topology of the field and release stored magnetic energy. The reconnection process will also result in the dissipation of electric currents which will transform electric energy into heat.
This is general idea of how magnetic carpet may be involved in the coronal heating. The idea is based on high resolution observations of magnetic fields and X-ray corona and existing theoretical mechanisms of coronal heating via electric current dissipation, microflares and magnetic flux emergence. It is too early, however, to state that the “magnetic carpet” ultimately solves the problem of the coronal heating, since a quantitative model of the process has not been proposed yet
Here we have a short movie of the Sun created from still frames from the Solar and Heliospheric Observatory (SOHO) spacecraft. Taken over several days, this movie shows the clear evidence of the magnetic activity on the surface of the Sun and flares that accompany this activity. Coronal mass ejections are also believed to be caused by the “snapping” of magnetic field lines that result in a massive release of energy and material in a very short period of time. Both flares and CMEs can interfer with satellites, ground communications and electrical power grids on Earth if the planet lays in the path of one of them.
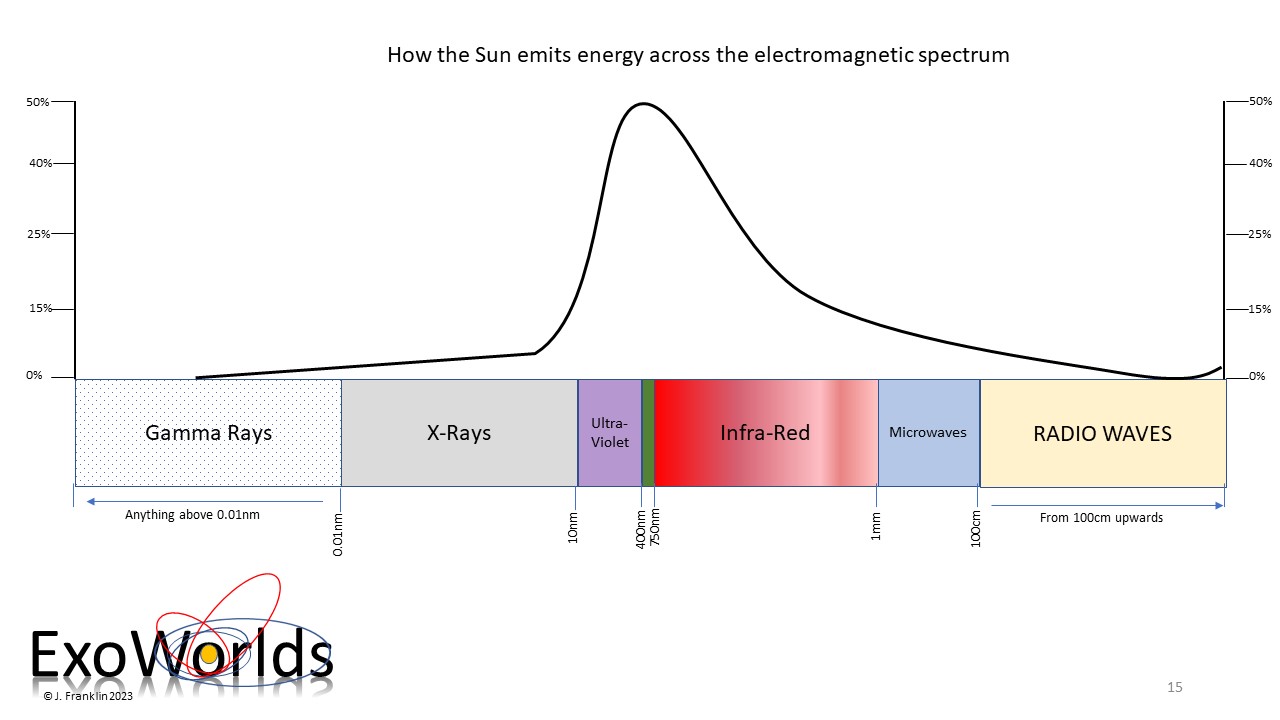
We look at the Sun, hopefully with averted vision because it can damage your eyesight, and see visible light, but the the Sun emits electromatgnetic radiation right throughout the electromagnetic spectrum, visible light is one small part of the whole spectrum.
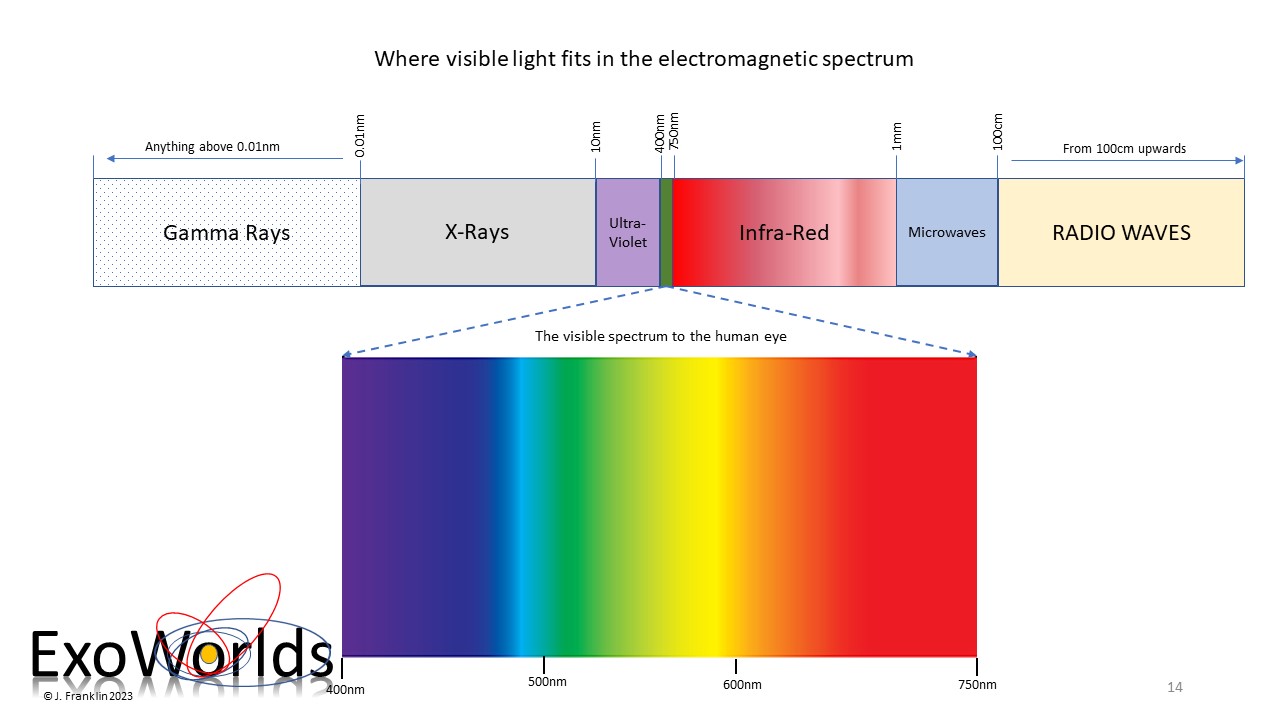
As you can see from the above graphic, radio waves can be many 1000’s of meters long, and gamma rays – well, they are anything under 0.01nm (0.000000011mm), but visible light exists in one very narrow window between 750nm (0.00075mm) and 400nm (0.0004mm), this is a section of the electromagnetic spectrum so narrow in comparison to it’s full extent that in the graphic above, the actual width of the visible spectrum range on the top part would be around 0.0002mm wide if it were possible to scale! We cannot see infra-red, but we can feel it – it is a type of electromagnetic radiaton we call heat. Pit vipers see with heat sensing pits, whereas Goldfish, for reasons no-one can answer, can see into the Ultra-violet range down to around 360nm.
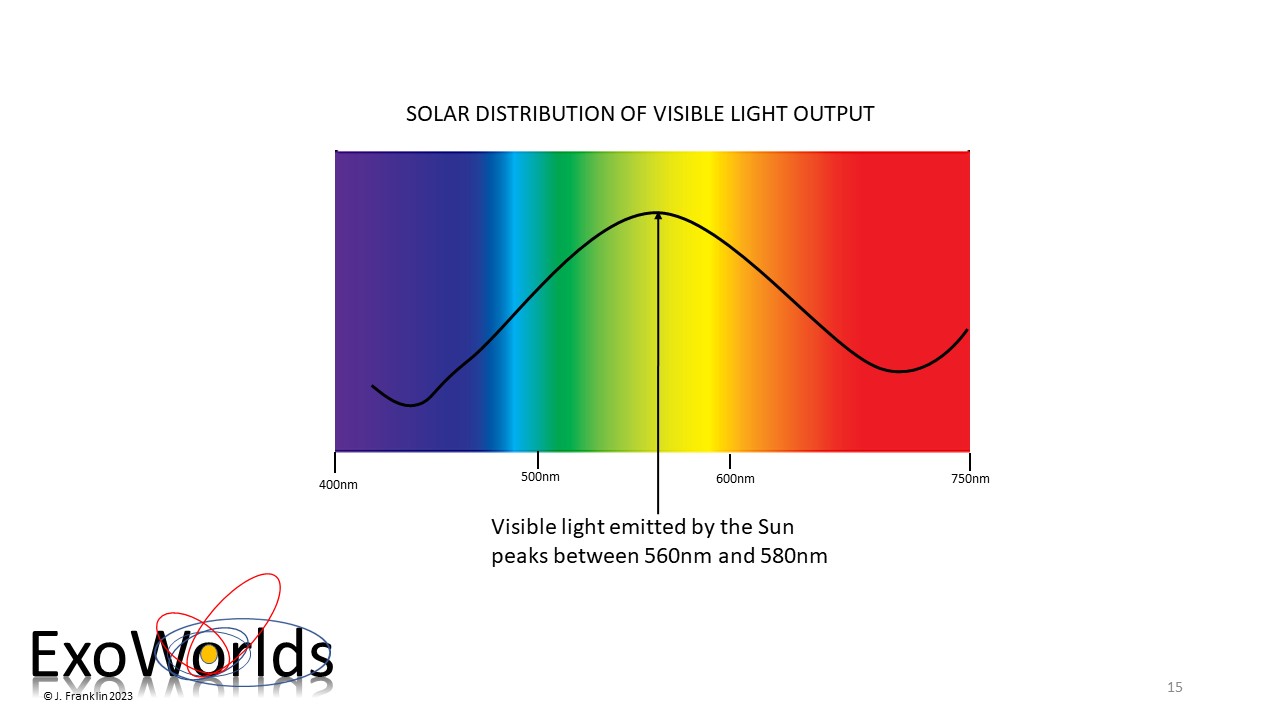
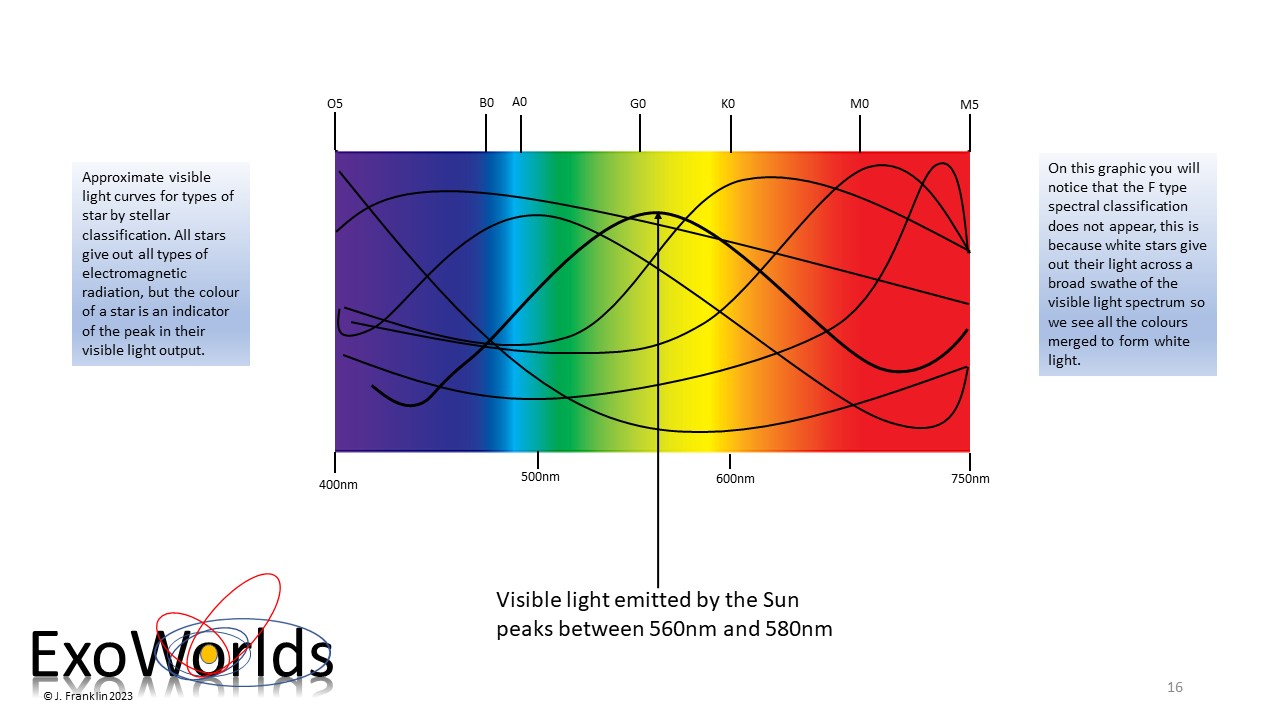
As you can see, the Sun gives out the bulk of it’s visible radiation at between 560nm and 580nm, but this does not mean it does not give out light right across the visible light spectrum, because it does – from radio waves right through to gamma rays.
Now lets see how the Sun fits with other types of stellar classification in the peak of their light output in visble wavelengths.
At this point it is wise to remind you, the reader, that the Sun, and all stars, emit radiation right across the electromagnetic spectrum – here is a representation of how the Sum emits it’s energy.