


The drive to electrification
Technology
As we are now a quarter of the way into the 21st century we have seen huge leaps in technology, 50 years ago, computers were the size of a small apartment, phones were attached to walls by a cable, homes were connected to the phone network by copper, Radio and TV was limited by the bandwidth of the radio channels it was allowed to use and cars, buses and trucks were powered by internal combustion engines that belched out noxious gases as a byproduct of even the cleanest engines.
Now, computers sit in our pocket and make the largest supercomputer of 50 years ago so by comparison – that computer in your pocket is now also your phone and a window to the world we have created, where the once tied to the wall powered by copper cable communications has been supplanted by fibre optic cables powered by lasers that attach to microwave transmitters that allow the world at your fingertips, instant communication, sorting your life out – or driving you crazy depending how you look at it. The same fibre optic cables now link our homes to TV services once not even dreamed of in science fiction novels, with hundreds of channels – not that quality has improved, but that is a different article for someone else to write. Our world has changed dramatically in my 57 years of life, even more so than the 57 years previous to that, and that technological march is a steam train moving forward with no hind of it slowing.
Battery Electric Vehicles.
One of life’s ironies is that some of the first cars ever made were electric, in fact, Thomas Parker, an English inventor made the world’s first production electric vehicle in 1884, followed 4 years later by German Andreas Flocken – in fact, in 1900, fully one third of all cars on US streets were electrically powered. London had electrically powered Taxis and the world looked good for this fledgling technology.
In 1901, Ferdinand Porsche, yes, the man who created that sports car company, produced the world’s first hybrid car when he mated a gas turbine engine to a generator that charged the batteries that powered an electric motor. Henry Ford actually partnered with Thomas Edison to look at manufacturing cheap electrically propelled vehicles, but another irony is that Ford’s cheap Model T dealt a killing blow to early electric cars, with the increase in road infrastructure, improved road surfaces and increasing numbers of fuel service stations, people drove far more and further than they had previously, thus the range of those early BEVs was unable to compete, sadly they died a death because the technology of the day was simply not mature enough for practicable applications outside niche sectors.
There things sat for almost 100 years of stagnation!
But what of our cars, buses, trucks and other systems that use internal combustion engines – well, apart from using computers to work more efficiently and produce marginally less noxious gases, they really have not changed – a diesel engine made 50 years ago would still work with modern diesel fuel – perhaps it would need a little adjustment, but it would work – I used to run a Land Rover on self-made fuel, legally, made from waste chip shop oil that was filtered, mixed with methanol and 5% ATF to help prevent clogging up the injectors – it ran fine for more than 100,000 miles until another driver wrote it off when he drove into the front of it. That is how little ICE technology has advanced in my 57 years.
Due to battery and electronic technology advancing leaps and bounds in the last couple of decades we are now seeing an increase in battery electric vehicles (BEVs), there are of course hybrid vehicles, but the push is toward conversion to BEVs. There are a number of models available, their range is increasing with every generation,, now up to around 450 miles in some cases, if you have the pockets deep enough to shell out well over £140,000 for one that is, but at the lower end, around the £50,000 mark, there are a number of offerings from various manufactures that offer a quoted 300-350 miles range, although real world testing has shown that even the most expensive BEV is only good for about 75-80% of the manufacturer stated performance figure. In reality, the cheapest cars will get you about 280 miles, and the most expensive will get you about 320-350 miles from 100% charge to 0% charge (Car Wow test).
There is a lot of debate about BEVs, some hate them, claiming they are a political con trick, or simply the spawn of Satan, others love them and see them as the panacea of all our fossil fuelled woes, but what is the truth – well that seems to depend on whom you ask, however, the reality is somewhere in the middle, they are one part of the solution to weaning ourselves of fossil fueled powered transport.
The fact is that we do need to wean ourselves off our reliance on fossil fuel powered vehicles, it does not matter whether we talk about private cars, vans, trucks, buses, shipping or aircraft – they all use fossil fuels to power them and produce a lot of noxious chemicals that poison humans and the environment in the process.
So, let’s take a look at the numbers of the different types of vehicles currently on British roads, it is a pretty diverse group, and there are many more than the data shows as many will not be registered with any DVLA or DVSA database as they are used on farms, are plant vehicles used on construction sites or in mining so they may not be included in the data sets available.
See Table 1 below.
Registered Vehicles on UK Roads Jan 2024
| Private Cars on UK Roads | 33.2 million | |
| Fossil Fuel Powered | 31.415 million | |
| Battery Electric | 1.01 million | |
| PHEV (Hybrid) | 645,000 | |
| Light Commercial Vehicles | 4.458 million | |
| Fossil Fuel Powered | 4.257 million | |
| Battery Electric | 57,342 | |
| PHEV (Hybrid) | 143,658 | |
| Taxis and PVH Vehicles | 289,400 | |
| Fossil Fuel powered | 125,600 | |
| Battery Electric | 98,428 | |
| PHEV (Hybrid) | 65,372 | |
| Mass Transit Buses and Coaches | 37,800 | |
| Commercial Vehicles over 3.5T GVW | 529,153 |
It is clear from the list above there is a way to go – only 3% of private vehicles registered in the UK are BEVs, Van BEVs account for a mere 1.2% of all Vans registered on UK roads – it is similar for buses, although cleaner buses are becoming increasing common with many fleets actively changing over to them where it is practical to do so.
So, what is holding back the wholesale adoption of BEVs?
- Fear of change?
- Cost to buy?
- Lack of infrastructure?
- Cost to run?
- Lack of knowledge and understanding?
For most it is likely all of the above, although the overriding factor will be the initial cost of purchase, in the UK, the cheapest electric car you can buy from new is the pug dog looking, utterly horrible, Citroen Ami at about £9,000 – with a reported range of only 50 miles and being horrible to drive it should not be on your list according to reports. See the Top Gear list for cheap BEVs
The reality is that all are genuine concerns, depending on where you live in the country will depend on the priority you put on them. Things are improving with regards availability of charging stations, this is a common negative thrown into the mix by the anti BEV community, as we will see below, the number of charging stations in the UK is increasing.
The cost of charging at commercial charge stations is dramatically increasing, the days of a cheaper fill up compared to fossil fuels has gone, this is especially true if you have a vehicle with a larger battery capacity.
Image 1 below shows how many charging stations and charging points there are in the UK as of March 2024, courtesy of Zapmap.

Image 2.
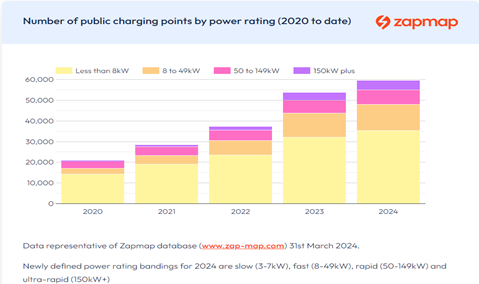
As you can see from Images 1 & 2 above, things are not as bleak as they once were, or nay sayers will blurt into conversations, but it does depend on where you live to how far you must travel to find a charging point away from home.
But what is the cost of charging, perhaps you are away for a few days, away for work, or maybe you have a problem with your home supply or charger – it’s not pretty.
Image 3:

These are the average prices, the cheapest in the UK at the time of writing is 51p/kWh and the most expensive is 104p/kWh.
The average BEV has a capacity of 40kWh, so the cost of charging it from 10% to 100% will vary from £15.30 to £31.20 – however, the question will be how long it will take…a 7kWh charger will need a little over 4 hrs to achieve 100% charge, but an ultra-charger could do the same job in about 30 minutes or so, assuming your car allows for this type of charging.
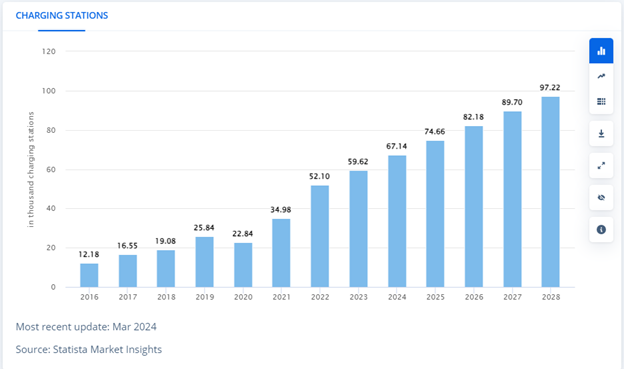
Currently, there are 1.01 million BEVs registered on UK roads, but how is this projected to change in the coming years – below, in image 4, we see the projected BEV market share growth rate is projected to climb at around 8.6% year on year until 2028 when it is expected that BEVs will account for 573,000 cars sold in the UK, whilst in Image 5, we see that the charging points are expected to grow to over 97,000 points across the length and breadth of the country. To put that in perspective, in 2000 there wewre 13,107 filling stations in the UK with an average of 6 pumps each – 78,642 pumps to service vehciles, in 2023 that number had dropped to 8,353 stations, with an average of 5.52 pumps for a total capacity of 46,108 pumps, a drop of over 40%.
Image 4: Projected BEV sales up to 2028
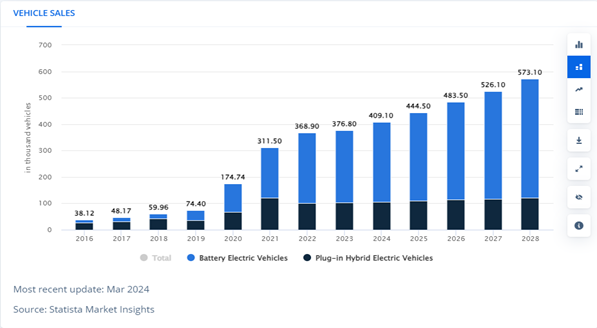
Image 5: Projected growth of Charging stations in the UK to 2028.
What this means is that more and more electric cars will need to be powered from the National Grid. This growth is not happening overnight, but it is happening. Not every ICE car in the UK will stop running just yet, but as demand for fossil fuels goes down, their cost will go up as the per unit cost increases, this will, in turn, motivate people to swap to an alternative, the majority will likely end up with a BEV, as they become more common, so their unit cost will stabilise, as we are starting to see now. There will come a point when, for petrochemical companies, the production of fuels will likely cease to be cost effective, at least for road cars, although that time is likely 20-30 off just yet as many nations in the world simply do not have the capacity to swap to BEVs in the near future. Developing nations are a mixed bag of infrasctructure that may support BEV sales, but realistically we are not going to see a significant drop in road fuel production for several decades.
In the meantime, we can say that as the BEV market grows here in the UK, so the demand for electricity to charge them will increase, that raises the question of whether the grid will be able to feed this extra demand, the 8.6% increase is not a lot, however, it adds up, by 2028 the projections are that the UK will have 3.5 million BEVs on the roads, industry experts suggest that based on current usage and charge rates, that would average out at 12kWh per vehicle per day. The increase in grid demand by 4.2GW – which is about 1.5% increase on the average demand on the Grid today – this is not breaking the bank.
However, the picture changes if the UK were to see a massive uptake in BEV sales and we had 16.5 million BEVs on the road, so replacing around 50% of existing cars/vans, that would require 192GW (1,681TWh/yr) if all vehicles averaged a 12KW charge per day – but this needs a careful look because at current sales rates, the UK has 1.01 million battery electric vehicles on our roads, sales are averaging 8.6% per year, it will take approximately 37 years for the UK to reach 16 million battery electric vehicles on the roads, assuming the average annual growth rate of 8.6% is maintained and that 20,000 vehicles are taken off the road each year due to age or accidents. Using this very same data, we can estimate the number of BEV’s that may be in use on UK roads.
Table 2
BEV Energy Demands
| Projected BEV cars on the road | Total KWh demand per year on the grid based on an average of 12KW per day per vehicle | Total Grid energy demand TWh | Percentage of 2023 Demand |
| 1,010,000 | 106,171,200,000 | 106 | 34 |
| 2,160,000 | 227,059,200,000 | 227 | 72 |
| 3,500,000 | 367,920,000,000 | 368 | 116 |
| 5,000,000 | 525,600,000,000 | 526 | 166 |
| 7,500,000 | 788,400,000,000 | 788 | 249 |
| 9,000,000 | 946,080,000,000 | 946 | 299 |
| 10,500,000 | 1,103,760,000,000 | 1,104 | 349 |
| 12,000,000 | 1,261,440,000,000 | 1,261 | 399 |
| 13,500,000 | 1,419,120,000,000 | 1,419 | 449 |
| 15,000,000 | 1,576,800,000,000 | 1,577 | 499 |
| 16,500,000 | 1,734,480,000,000 | 1,734 | 549 |
As can be seen, the demand on the grid will grow dramatically from the use of BEV’s. Some of this demand can be mitigated by the use of domestic solar PV sytems being used to charge vehicles in daylight, but the majority will likely be plugged in at night, however, there may be an increase in battery storage systems to store energy from solar in the daytime and use this to charge the vehicle at night, however, this will not be fast process, even with the introduction of Sodium-Ion batteries for home storage. Should 30% of vehicles be charged from battery storage, daytime solar or simply not used, the data indicates that BEVs alone will put a strain on the generation capacity of the national grid.
What are the other Demands on the National Grid?
Domestic Gas Transition
As the nation moves, inexorably, to a carbon free energy generation capability we will see that the use of natural gas (methane) will be phased out, although the government has no specific plans on when this may happen, there has been a roll back by the Government on when the installation of gas fired boilers in new homes should cease – who knew a Government would do a policy U-turn – originally from 2026, this is now from 2035, the grant for replacing existing gas/oil fired boilers has been increased to £7500 – however, a fixed grant cap may not be sufficient to incentivise people to make the change, an ASHP can cost from £2,500 to £14,700 plus installation costs, further, depending on your home, its age and ecurrent insulation, you may need to pay out for better insulation
Clearly, homes and businesses moving over to electrically fired heating system will impact the demand on the grid, but this will be a slow creep as it will take many years for all homes to be converted, but there will come a day when the purchasing of natural gas, propane or fuel oil for the heating of homes will become too expensive due to the drop in demand, thus more and more homes and businesses will look at alternative power sources.
There will be homes, especially those that are currently “off grid” that may not be in locations that suit air or ground source heat pumps, and as there are currently around 4.4 million homes that are not connected to the main gas grid, that is, potentially, a lot of homes that will require expensive and possibly problematic upgrading to make use of electric heating – did anyone say wood fired Aga?
Of the 28 million domestic homes in the UK, around 23.58 million (84%) use natural gas from the “grid”, the government wants as many of these changed to air source heat pumps as possible and has set the lofty goal of 600,000 per year up to 2028, how realistic is that?
Image 6: ASHP sales in the UK year on Year (Heat Pump Association)
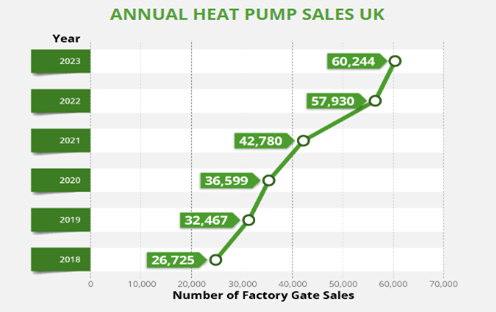
Note: Leaving the factory gate does not mean “actually installed”, some units may be with installers and wholesaler suppliers.
Let’s not forget that to install this equipment, you require trained staff, those that can install the equipment correctly and safely, they must be registered and have passed an approved training course for the homeowner to receive the Government grant of £7500 – so how many trained installers are there in the UK that would meet the requirements under the Government scheme…
Image 7:
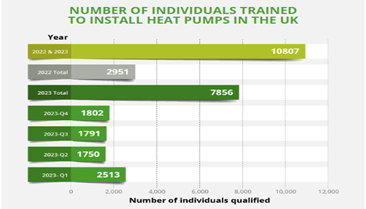
Thus, we have a total of 10,807 certified installers in the UK, that would mean, to meet the government target, each installer would need to install an average of 55.5 units each per year – about 1 per week, which is an achievable goal, the MCS estimate it takes from 3 to 8 days to install a new unit in a home (depending on home size and difficulty) – if the market supported this installation rate – which it clearly does not appear to at the moment, the manufacturers are selling around 10% of the units that the government pledged to have installed – and bear in mind, almost 77% of the ASHP sold in the UK in the last several years have been to developers who installed them in new builds, the Government target of 600,000 per year is laughable at the current installation rate.
However, let’s assume, for one minute, the government gets its act together (who doesn’t like a good fiction story!) and we start to see 600,000 units installed per year, what does that do to our power demand?
When you search for an average rating of heat pumps, you can get figures that range from 4.0kWh to 10kWh, depending on the data from manufacturers or “insiders”, so let’s pick the middle, as the most common units sold so far are 7.5kW (note – the size of unit installed is dependent on a lot of factors – it could be as high as 16KW for an individual house) – that equates to around 39TWh per year (9-12% of current demand depending on usage), however, there are some 220,000 already installed, they account for ~ 13.9TWh per year, or ~3% of current demand.
Lets take a look at what the data tells us as the use of ASHPs increases.
Table 3
Air Source Heat Pump (ASHP) Demand on National Grid
| Total number of Air Source Heat Pumps | Total KWh demand per year | TWh Demand per year | Total demand allowing for 30% run from Solar, Battery storage or not used. | Percentage of 2023 Demand at 100% use | Grid connected Percentage of 2023 Demand based on 40% usage |
| 220,000 | 14,454,000,000 | 14.45 | 10.12 | 4.57 | 1.28 |
| 500,000 | 32,850,000,000 | 32.85 | 23.00 | 10.40 | 2.91 |
| 600,000 | 39,420,000,000 | 39.42 | 27.59 | 12.47 | 3.49 |
| 750,000 | 49,275,000,000 | 49.28 | 34.49 | 15.59 | 4.37 |
| 1,000,000 | 65,700,000,000 | 65.70 | 45.99 | 20.79 | 5.82 |
| 1,250,000 | 82,125,000,000 | 82.13 | 57.49 | 25.99 | 7.28 |
| 1,500,000 | 98,550,000,000 | 98.55 | 68.99 | 31.19 | 8.73 |
| 1,750,000 | 114,975,000,000 | 114.98 | 80.48 | 36.38 | 10.19 |
| 2,000,000 | 131,400,000,000 | 131.40 | 91.98 | 41.58 | 11.64 |
| 5,000,000 | 328,500,000,000 | 328.50 | 229.95 | 103.96 | 29.11 |
| 1,000,000 | 65,700,000,000 | 65.70 | 45.99 | 20.79 | 5.82 |
| 15,000,000 | 985,500,000,000 | 985.50 | 689.85 | 311.87 | 87.32 |
| 18,000,000 | 1,182,600,000,000 | 1,182.60 | 827.82 | 374.24 | 104.79 |
| 20,000,000 | 1,314,000,000,000 | 1,314.00 | 919.80 | 415.82 | 116.43 |
| 22,000,000 | 1,445,400,000,000 | 1,445.40 | 1,011.78 | 457.41 | 128.07 |
| 24,000,000 | 1,576,800,000,000 | 1,576.80 | 1,103.76 | 498.99 | 139.72 |
| 26,000,000 | 1,708,200,000,000 | 1,708.20 | 1,195.74 | 540.57 | 151.36 |
| 28,000,000 | 1,839,600,000,000 | 1,839.60 | 1,287.72 | 582.15 | 163.00 |
At the current rate of installation of ~60,000 units per year it will take the UK some 463 years to install one in every existing home and any new ones up to 28 million homes – clearly that is ridiculous, however, the Government has hinted that it wants every grid connected home to have an ASHP installed, rather than a gas boiler, by 2050- there are 23.45 million homes currently connected to the gas grid – that is a collosal installation rate of 893, 462 ASHPs to be installed annually – our current install rate is just 6.9% of that – and this does not accounor those installed in new builds, which is 78% of the existing installation rate.
If the government are serious, they need to get serious an look at how they can improve this situation so the whole country benefits.
Quote from the International Energy Agency
“Increased policy support and incentives for heat pumps in light of high natural gas prices and efforts to reduce greenhouse gas emissions were key drivers behind the strong uptake. In Europe, heat pumps enjoyed a record year, with sales growing by nearly 40%. In particular, sales of air-to-water models, which are compatible with typical radiators and underfloor heating systems, jumped by almost 50% in Europe. In the United States, heat pump purchases exceeded those of gas furnaces. However, in China, the world’s largest heat pump market, sales remained stable amidst a general slowdown of the economy.”
Globally, a lttle over 3 million ASHP’s were manufactured in 2023 (EHPA), so the global supply capacity is there, but, ironically, the more any given country demands, the less are available in others, thus, as demand increases so does their unit price, its a typical supply and demand problem. Governments, suppliers and manufacturers need to work together to ensure that heat pump prices remain competitive because as their price increases, interest from the public will diminish, especially if the international situaion improves so that wholesale natural gas prices fall, making remaining with natural gas a more attractive option for cash strapped families. It should be noted that such a fall in natural gas wholesale prices would also have a knock on impact on the wholesale cost of electricty generation for states still operating natural gas generation plants.
Mass Transport Systems (Railways)
The UK’s rail electrification program, currently underway, aims to significantly increase the portion of the rail network that uses electrical power. This initiative is part of a broader effort to enhance the sustainability and efficiency of the rail system. Currently, electric trains account for 55% of rail traffic, this is expected to grow as more tracks are electrified. The program includes major projects like the electrification of the Great Western Main Line and other key routes, which will expand the electrified network to encompass three-quarters of all rail traffic in Britain by 2035 if government projections are to be taken on face value. (HS2 anyone?)
With these developments, the energy demand from the rail sector is expected to evolve significantly by 2040. If current trends and policies continue, nearly all major rail transport in regions like Europe and Japan will be electrified, which could lead to a 36% increase in total energy demand for the rail sector by 2040 compared to a baseline scenario. This shift is driven by the ongoing expansion of high-speed and urban rail systems, particularly in China, which has rapidly built extensive new networks.
In summary here, the electrification and expansion of the UK’s rail network are set to transform its energy consumption pattern significantly, making it a more prominent part of the national energy landscape by 2040. Calculating guideline energy demand over this period is difficult due, in large part, to delays, changing government strategies and policies and the opportunity for newer, cleaner, more energy efficient trains to be introduced. However, Network Rail estimate that the electrification of the UK rail network will increase energy demands by 12.7% year on year until 2050, buy which time they expect the entire network to be electrified, with a few minor exceptions in very rural Scotland and Wales.
Retail and Commercial Buildings (Excluding Industry)
Many commercial and office buildings use gas for primary and domestic hot water heating – transferring them to air or ground source heat pumps is not that simple, especially in London – I have heard that the London Underground gets funny about you drilling holes down through the tunnels – who knew!!
So, let’s just concentrate on the smaller business sector who are usually in a better position to transfer to ASHP than a large commercial property or office building.
The UK has about 350,000 small retail, workshop and office buildings that are in use (as of December 2023) – so let’s make an assumption on their requirements, most will be similar size to a domestic property, and some will require significantly larger – thus we will settle on 15kW ASHP units installed for all as an average. There is little data available on how many have been installed to date or what their rate of installation is, however, if we simply do some basic calculations, based on 15KW units as an average, take into account some will likely be powered by solar PV, small scale turbines etc we can see in the following table what the maximum potential and the realistic likely potential demands on the energy grid may be.
Table 4
Small Commercial and Retail Air Source Heat Pump (ASHP) Demand
| Total number of Air Source Heat Pumps | Total KWh demand per year | Maximum potantial TWh Demand per year | Total potential demand allowing for 50% run from Solar, Battery storage or not used. | Total potential demand based on 50% usage rate | Maximum Potential Demand Percentage of 2023 Demand | Likely Probable Demand % of 2023 Demand |
| 10,000 | 1,314,000,000 | 1.31 | 0.66 | 0.33 | 0.42 | 0.10 |
| 50,000 | 6,570,000,000 | 6.57 | 3.29 | 1.64 | 2.08 | 0.52 |
| 90,000 | 11,826,000,000 | 11.83 | 5.91 | 2.96 | 3.74 | 0.94 |
| 150,000 | 19,710,000,000 | 19.71 | 9.86 | 4.93 | 6.24 | 1.56 |
| 200,000 | 26,280,000,000 | 26.28 | 13.14 | 6.57 | 8.32 | 2.08 |
| 250,000 | 32,850,000,000 | 32.85 | 16.43 | 8.21 | 10.40 | 2.60 |
| 300,000 | 39,420,000,000 | 39.42 | 19.71 | 9.86 | 12.47 | 3.12 |
| 350,000 | 45,990,000,000 | 45.99 | 23.00 | 11.50 | 14.55 | 3.64 |
There is, of course, one sector of the large commercial world that we can make reasonable predictions about – because they are constantly telling us.
Data Centres and the growth of AI
Data centres have been around since the birth of computing, but there is no real true definition of what a data centre actually is, some are small, housing perhaps a dozen or slightly more servers for an individual client, but some are giants that have numerous Data Halls, many have significant footprints and energy demands.
The growth of the Internet and the IOT technologies in the last decade have seen a huge growth in the DC market, the UK is currently home to 513 Data Centres, mostly clustered in and around London, but there are sites all over the country. They use a lot of energy. National Grid ESO, in their latest data release, estimate that Data Centres account for about 1.5% of the energy demand of the UK, but we all know this is changing.
The rise of Artificial Intelligence algorithms has meant that data centre growth is inevitable in the UK, this is happening already. How will this impact UK Energy demands?
National Grid ESO produce Future Energy Scenario (FES) reports annually, the below image uses data from their 2022 report and demonstrates the uncertainties around the demand by data centres and other demands on the electrical generation and delivery systems..
Image 8: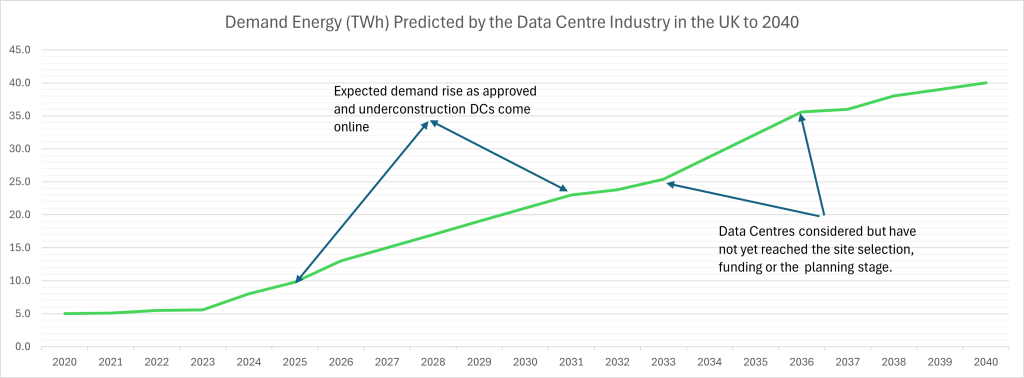
Data Centres need to run as efficiently as possible; many people are unaware of the efforts that go into making any DC run efficiently – especially the colocations data centres that rent space to multiple clients, they make more money if they can lower the PUE of the data center. If you are not aware of what PUE is, it is an acronym of Power Utilisation Effectiveness – you may still be none the wiser – in simple terms, the less energy the data centres use to cool the computers using refrigeration plant, Air Handling Units (AHUs) etc, the more cost effective the data centre is.
PUE = Total Facility Energy / IT Equipment Energy
Example: The total energy required to run Data Centre A is 12,500 KW, but the IT load only requires 7,250 KW, thus
12,500 / 7250 = 1.72 – thus the PUE of Data Centre A is 1.72
Data Centres have a range of efficiencies, and this can vary over the course of a 24hr period as IT load and cooling requirements vary, Data Centres tend to be more efficient in colder months when they can use “free air cooling” to remove waste heat from cooling water, but on a hot summer day their efficiency can be hit as the refrigeration plant has to work hard to keep cooling water in the ideal range to ensure the computers do not “cook”. See the table below for PUE rating data.
Table 5
PUE Ratings from The Uptime Institute
| PUE Rating | Level of Efficiency | Possible causes? |
| 3.0 | Extremely Poor | Very old with older cooling tech |
| 2.8 | Extremely Poor | |
| 2.5 | Very Poor | Older Cooling tech and possible environmental issues. |
| 2.2 | Poor | |
| 2.0 | Poor | |
| 1.8 | EU Average | Commercial pressures force DCs to run as operationally efficient as possible, the use of “Free Cooling” as often as possible assists those in more temperate regions. |
| 1.7 | Reasonable | |
| 1.6 | UK Average (Varies from 1.49 to 1.68) | |
| 1.5 | US Average (Varies from 1.5 to 1.59) | |
| 1.4 | Good | There are several DCs of newer designs that utilise renewable energy sources and cooling technologies that dramatically improve their ability to maintain ideal temperatures. |
| 1.3 | Very Good | |
| 1.2 | Very Good | |
| 1.1 | Extremely efficient | |
| 1.0 | Extremely efficient | |
| 0.9 | There are few DCs that report this level of efficiency, but as technology improves and cooling technologies become better, more DCs will end up towards this point. |
Most data centre operators will do their best to run as “lean” as possible, to ensure that contractual SLAs and KPIs, with regards energy usage and temperatures are me, they will try to ensure that as little energy is wasted as possible – this has a big impact on their profits – these days, the better your PUE, the better you are viewed in the industry.
However, we need to see how data centres will impact energy demand on the grid in the coming decades, there are various reports, feel free to google them, that discuss how data centre demand will escalate due to the adoption of AI – in 2023 the Data Centre industry used an estimated 0.8% of UK energy demand (about 60% that of the NG ESO Report estimate), this rounds to 2.52TWh of the total energy the whole of the UK used (316TWh) – a continuous load of ~0.56MW for each across the 513 Data Centres.
If the worst predictions are correct, then the energy demand of this sector will double by 2026, then increase 5-fold by 2030, even conservative estimates suggest a 3-fold increase in demand by 2030 – that means, by 2030 the UK data centre market could be consuming as much as 12.6TWh.
Obviously, it is hard to predict how the DC market will grow in the UK, environmental concerns and many “NIMBY” attitudes, as well as planning delays and grid connection issues cause innumerable delays which may even result in DC operators not investing in the UK as much as in the past, personally I hope that changes and the UK is seen as a good investment opportunity, but the planning and other delays in the DC market is outside the scope of this report, but they really need to be fixed.
Overall Demand changes for the UK Energy Grid
Now let’s take an overall look at the expected demands on the UK energy grid in the next 20 years.
Table 6:
| Sector | Current Demand | Expected Demand 2030 | Expected demand 2035 | Expected Demand 2040 |
| Battery Electric Vehicles | 4.42TWh/yr. | 7.88TWh/yr1 | 11.91TWh/yr1 | 17.98TWh/yr1 |
| Domestic Energy | 98.7TWh/yr2. | 176.45TWh/yr3 | 702.59TWh/yr4 | 1385.24TWh/yr5 |
| Small Commercial and Retail energy | 37.24TWh/yr6 | 60.14TWh/yr7 | 62.48TWh/yr8 | 63.42TWh/yr8 |
| Mass Transport | 3.7TWh/yr9 | 8.95TWh/yr10 | 29.71TWh/yr10 | 76.099TWh/yr10 |
| Data Centres | 2.52TWh/yr11 | 5.67TWh/yr12 | 12.3TWh/yr12 | 15.4TWh/yr12 |
| Industry | 81.7TWh/yr13 | This has not been looked at due to the many engineering challenges faced with decarbonising large buildings, and large manufacturing sites. | ||
| Services/Other | 81.72TWh/yr13 | |||
| Totals | 310TWh/yr | 259.09TWh/yr 14 | 818.99TWh/yr 14 | 1,558.139TWh/yr14 |
Table 7 – Notes for Table 6
| 1 | Energy requirement based on expected sales forecasts with an 8.6% increase in sales over this period. This figure is likely to fluctuate over the next 16 years. |
| 2 | Data from National Grid, March 2024. |
| 3 | Data based on there being 1.25 million air source heat pumps in use by this date. This figure may increase if installers increase the current installation rate from 61,000 to 100,000 per year. |
| 4 | Figure based on the installation rate for air source heat pumps increasing to 2.5 million per year to meet government targets. |
| 5 | Figure based on the 2.5 million per year installation rate and taking us up to the 23.58 million homes currently deemed suitable for air source heat pumps. |
| 6 | Data based on National Grid March 2024. |
| 7 | Figure calculated based on all 350,000 small retail/businesses converting to air source heat pumps by 2030 (The definition of the size of these businesses is fluid and makes this a somewhat arbitrary to decide on) |
| 8 | Figure based on expected increase in energy demand, including the aforementioned air source heat pumps. |
| 9 | Date from National Grid March 2024 and Network Rail January 2024 |
| 10 | The figures here are based on the projected growth of 12.7% in energy usage due to the electrification of the rail network. |
| 11 | Data from National Grid March 2024 |
| 12 | Figures calculated on expected growth rate in Data Centres based on industry projections and assumptions by industry experts. These are fluid figures that may decrease, or increase based on government policies and industry reactions. |
| 13 | National Grid March 2024 |
| 14 | These figures are incomplete as they do not include data for Industry and Services/Other as these were not projected for this report. |
NATIONAL GRID
So where does the capacity of the National Grid leave us with this extra demand, there are lots of protestations that the UK electricity generation industry is unable to cope with the demand that the full electrification of the country demands, many other voices claim that National Grid can deliver the demand required – lets see. According to the latest data, National Grid has a capacity of 340TWh, although that is bound to change in the coming years as suppliers take some plants offline for decommissioning and there is an increase in the renewables sector.
The UK has a lot of generation capacity according to the annual DUKES (Digest of UK Energy Statistics) Report (Department for Energy Security and Net Zero)– the capacity appears to be significantly larger than a lot of the public believe and many commentators indicate. However, where does that leave the nation as demand increases. Many comentators simply do not understand how the real world day to day capacity of the generation industry is calculated.
Even if the worst-case scenarios do not come to pass, our energy grid will see increasing demands on its capacity between now, 2040 and beyond – see table 6 above – due to changes in the fuel type used for various sectors.
In table 8, below, we see what the current state is of the energy infrastructure of the UK.
Table 8: National Grid Generation Capacity (July 2023)
| Type | Maximum Capacity | Number of Plants | % of UK Gen Cap |
| Nuclear | 5.883 GW | 5* | 7.38% |
| Solar | 4.88GW | 640 | 6.09% |
| Wind – Onshore | 11.483GW | 428 | 14.33% |
| Wind – Offshore | 14.36GW | 49 | 17.93% |
| Natural Gas | 30.31GW | 43 | 37.84% |
| Diesel/ Gas Oil | 10.72 | 19 | 13.38% |
| Other Sources | 2.44GW | 148 | 3.04% |
| Totals | 80.081GW | 1332 | 100% |
The government has set an ambitious goal of generating some 40GW of energy from wind by 2030, a lofty and ambitious goal, made even more important by the increased demand by the decommissioning of our aging nuclear power stations and the decommissioning of the older, more polluting, Gas fired power stations, although it is looking like the industry will only have around 30GW of generating capacity by 2030.
Further, by 2030, 17 of the aging gas plants are due to be decommissioned, the government has committed to building new, environmentally friendly and more efficient plants or improving the existing gas-powered inventory, but all this could be a moot point if the government changes at the next election and the Labour Party instigate their new policy of decarbonising the power generation grid by 2030, that would mean the UK would lose, potentially, the capacity to generate up to as much as 50GW (0.438TWh/yr.)– and whilst the industry is likely on target for 30GW of wind by 2030 – that would still be a massive shortfall in possible generating capacity –about 35GW (0.306TWh/yr.) in reality.
So, where does this leave the nation’s energy requirements in 2030
Table 9: Projected Generation Capacity of the National Grid (Government and Policy dependent)
| Type | Maximum Capacity (GW) | Capacity Factor | Generated Capacity (GW) | Annual TWh capacity |
| Nuclear | 3.2 | 80% | 2.56 | 22.425 |
| Wind (Onshore) | 11.483 | 25% | 2.8750 | 25.185 |
| Wind (Offshore) | 30 | 45% | 16.5 | 144.54 |
| Solar PV | 6.2 | 13% | 0.806 | 7.060 |
| Natural Gas | 25.2 | 60% | 15.12 | 132.451 |
| Other Sources | 2.44 | 50% | 1.22 | 10.687 |
| Totals | 78.523 (688.378TWh) | 49.5% | 39.081 | 342.348 |
In table 9 we can see a sharp decrease in the generation capacity of the grid as a result of the decommissioning of the older nuclear facilities and some older gas plants, although some gas plants will be replaced with new, cleaner types and some will be upgraded, the overall figure is due to fall based on current industry projections, the picture may improve if the Wind Industry can meet the 40GW capacity the government wants. We should also note that Hinkley Point C (due online in 2026) and Sizewell C (due 2034) nuclear power stations are currently being built or going through the planning stages. Each will have a maximum capacity of 3.2GW.
Based on reasonable accurate projections with the available data, if the Industrial sector and the Services/Other sectors remain energy stable over the next 6 years, the nation will require the generating capacity for 422.5TWh – which would be equivalent to 48.2GW generated every hour of every day (This will vary within the course of a day) – but in this we have a problem, the capacity appears to be there on paper, but is it in reality?
Generating plants cannot run all the time, they require maintenance, component replacement and in the case of solar and wind, susceptible to the vagaries of mother nature who stubbonly refuses to play ball.
This downtime in the generating industry is called the Capacity Factor, and it varies depending on the type of generation plant, as you may perceive, it has a big impact on the available “real” energy that can be generated for the energy demand of the nation.
Let’s take a look at the capacity factors for various types of electrical energy generation.
- Nuclear Power: Capacity factors for nuclear power plants are typically high, often ranging from 80% to 90%. Nuclear plants are designed to operate continuously and can achieve high capacity factors under normal operating conditions. They are one of the most reliable forms of energy generation we have.
- Natural Gas (Combined Cycle): Capacity factors for natural gas-fired power plants can vary depending on factors such as market demand, fuel prices, and grid conditions. On average, capacity factors for combined-cycle natural gas plants can range from 50% to 70%. They actually run more efficiently the longer theyre left running.
- Solar Photovoltaic (PV): Capacity factors for solar PV systems vary widely depending on factors such as location, weather conditions, and system design. On average, capacity factors for solar PV systems typically range from about 10% to 25%, the average capacity factor for solar photovoltaic (PV) systems in the UK typically ranges from about 9% to 13%.
- Wind Power: Capacity factors for wind turbines also vary depending on factors such as wind speed, turbine efficiency, and location. Onshore wind farms typically have capacity factors ranging from 25% to 45%, while offshore wind farms can achieve even higher capacity factors, often exceeding 45% and as high as 75%
- Hydroelectric Power: Capacity factors for hydroelectric power plants can vary depending on factors such as reservoir management, seasonal variations in water availability and plant design. On average, capacity factors for hydroelectric power plants typically range from 40% to 60%. Hydro power in the UK is a very tiny contributor to our energy infrastructure.
- Wave Power: Capacity factors for wave power generation systems are still being developed, there is variability in estimates depending on the specific technology and location. Currently, capacity factors for wave power systems are generally lower compared to more established technologies, often ranging from 20% to 40% in theoretical estimates. However, at the time of writing, the UK goverment support for wave generation schemes is low, amounting to around £1.9 million per year, total UK generation from wave power amounts to around 40MW in total
- Tidal Power: Tidal energy systems, like wave energy systems, are still in the process of development and deployment at commercial scale. As such, specific capacity factors and efficiency metrics can vary based on the technology, location, and operational factors. However, tidal energy systems generally have the potential to achieve relatively high capacity factors compared to some other renewable energy sources due to the predictability and regularity of tidal currents. While specific capacity factors can vary widely depending on factors such as the design of the tidal energy system, the characteristics of the tidal resource, and operational considerations, some estimates suggest that tidal energy systems could achieve capacity factors in the range of 20% to 40% or even higher in favourable locations with strong tidal currents. It’s important to note that these estimates are subject to change as tidal energy technology continues to evolve and as more projects are deployed and data becomes available. Additionally, factors such as environmental impact assessments, regulatory approvals, and grid integration can also influence the performance and efficiency of tidal energy systems. UK Government support for tidal power seems to be none-existant.
- Geothermal: Geothermal and the UK are not terms that usually go together, however, the Eden Project in Cornwall has successfully drilled a test hole and it does appear the government is getting on board with the idea that we can tap the natural heat under our feet to heat our homes or generate electrical energy. The UK does not have the same geothermal capacity, with current technology, as other European countries, such as Iceland, Italy, France and even Germany, where there is active or dormant volcanic areas, but there is sufficient capacity to help offset the demands on other generation sectors, especially as it is one renewable source that is available 24/7. There is no data on the Capacity Factors for plants here in the UK, but in the USA they have been running for many decades with capacity factors between 40% and 80% – similar to that seen in Iceland and other locations. The House of Lords Report on UK Geothermal can be read here
So, now let’s look at the available energy.
Table 10. Theoretical versus Reality.
| Type | Maximum Capacity (GW) | Capacity Factor | Generated Capacity (GW) | Annual TWh capacity |
| Nuclear | 3.2 | 80% | 2.56 | 22.425 |
| Wind (Onshore) | 11.483 | 25% | 2.8750 | 25.185 |
| Wind (Offshore) | 30 | 45% | 16.5 | 144.54 |
| Solar PV | 6.2 | 13% | 0.806 | 7.060 |
| Natural Gas | 25.2 | 60% | 15.12 | 132.451 |
| Other Sources | 2.44 | 50% | 1.22 | 10.687 |
| Totals | 78.523 (688.378TWh) | 49.5% | 39.081 | 342.348 |
From table 8 we can see that whilst the generation capacity is theoretically 80.081GW, equivalent to a little over 700TWh, the reality, taking into account capacity factors, is only around 52.72% of the potential capacity at 36.13GW, equivalent to around 316.5TWh.
In Table 9 we see that the projected generating capacity will be 78.582GW, equivilent to 688.378TWh, bute Capactity Factorsits around 49.5%, thus we willonly have the capacity to generate around 342.348TWh
We saw above that the projected energy demand will likely be around 422.5TWh in 2030, which is some 117% above the expected capacity assuming all new and updated equipment is running as per government plans and projections. In reality, it is unlikely that by 2030 the demand will have increased that much based on the projctions of BEV sales and the installation of heat pumps, but there is no doubt that the coming 2 decades wl see a significant shift from fossil fuels in road transport, home heating, increases by the Data Centre industry and that small, but nt insignificant increase in demand from the mass transport industry. This does not take into account changes in how large commercial and office buildings will be heated, how state owned building will be heated – schools are a major user of natural gas for heating class rooms and other areas, if the government is forcing change on the public and industry, they need to lead by example – that is a massive can of worms to open right there which would increase demand dramatically.
Meeting Future Energy Demands?
Assuming we can maintain a 50% average capacity efficiency, we need an actual capacity of a minimum of 96.5GW, but if the real capacity is less than this, we have a problem. Should both Hinkley Point C and Sizewell C come online on time that will only be an additional 6.4GW (43.9TWh) with an 80% Capacity Factor thus being 5.2GW, so the projections for meeting demand in 2040 become an even bigger challenge to meet.
Whichever way you look at this, the UK has a mountain to climb to meet it’s “Green” commitments and ensure the lights stay on, realistically we need to build several new Nuclear Power stations and double the desired wind turbine capacity to around 80GW (Capacity Factor equivilent to around 40GW) to ensure that we have the capacity and allow for downtime.
Table 11.
| Type | Maximum Capacity (GW) | Capacity Factor | Generated Capacity (GW) | Annual TWh capacity |
| Nuclear | 8.4 | 80% | 5.2 | 45.552 |
| Wind (Onshore) | 11.483 | 25% | 2.8750 | 25.147 |
| Wind (Offshore) | 80 | 45% | 36.0 | 315.36 |
| Solar PV | 11.5 | 13% | 1.495 | 13.096 |
| Natural Gas | 25.2 | 60% | 15.12 | 132.451 |
| Other Sources | 3.54 | 50% | 1.77 | 15.5 |
| Totals | 140.123 | 62.46 | 547.106 |
There are ways to mitigate this and reduce overall grid demand, but it will take bold moves by Government that have to be embraced by the public, and that will mean a complete rethink of how we us our electrical grid.
- Change the building regulations to require, by law, all new homes to be heated by air source heat pumps, or ground source heat pumps for blocks of flats where ground conditions allow.
- Change the building regulations to require all new homes to generate at least 10KWh of the energy demand from solar panels and small scale wind turbines, with excess fed into the grid. Homes would be paid for the excess electricity they feed into the grid.
- Data Centres. All new data centres to generate at least 50% energy requirement from wind turbines, solar PV and heat pumps (air and ground source).
- All new commercial building must generate at least 50% of their energy requirements on site.
- Government to increase grant funding to allow all homes in the UK to have Solar PV installed and small scale wind turbines to generate 10KWh. 50% of revenue from energy generated paid to the Government for first 5 years.
Introducing all new homes and existing homes to the grid could potentially generate up to 30TWh per year (allowing for what homes use), people would be generating an income which would not only ease their financial burdens due to not paying electricity bills, but they would be making a small profit – potentially in the £1500 – £4000 range depending on how much their home generates and how much they actually feed into the grid. An intelligent Government would make this tax free income as it benefits the nation. Bear in mind, if homes added 30TWh to the grid,that would also mean they would not be extracting from the grid, so the real boost could be as much as 60TWh.
The information used in this report was gathered from multiple sources to ensure the data is as accurate as possible, but as with all forecasts, there is room for considerable change from that predicted. The world is a volatile place, world events can impact technology development, national infrastructure projects and economies. However, we know the world is changing and we require the electrical grid to not only be more robust that ever but have the capacity to meet the needs of the country and possibly earn revenue by exporting to our neighbours.